XRP price has recently demonstrated a sideways price action, deviating from the overall trend witnessed across the cryptocurrency market and altcoins.
Despite a modest 2% growth in the past 30 days, with prices ranging between $0.6427 and $0.5994, a crypto analyst operating under the pseudonym James Crypto has made a bold prediction based on Elliott Wave Theory’s interpretation of XRP’s monthly chart.
Grand 5th Wave And Potential Rally For XRP Price
James Crypto points to an intriguing possibility of XRP price entering a grand 5th wave, drawing attention to the extended durations of Wave 1 and Wave 3.
The Elliott Wave Theory, developed by Ralph Nelson Elliott in the 1930s, is a technical analysis tool widely used to forecast future price movements in financial markets.
The theory suggests that price movements unfold in recurring wave patterns, which can provide insights into potential future trends.
According to the theory, a complete market cycle consists of five waves, with three impulse waves (1, 3, and 5) and two corrective waves (2 and 4). The fifth and final wave is often associated with a significant price surge before a potential reversal or consolidation.
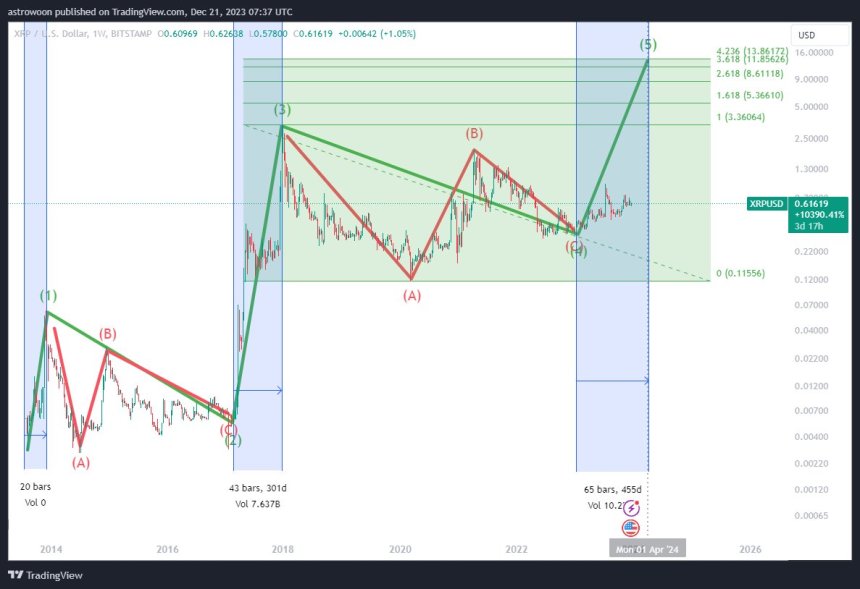
James Crypto’s analysis focuses on XRP’s monthly chart, which provides a broader perspective on the asset’s price movements.
The extended duration of Wave 1 (20 weeks) and Wave 3 (spanning over 40 weeks) caught the analyst’s attention. By extrapolating this trend, the theory suggests the possibility of a 60-week Wave 5, which could mark a substantial price rally for XRP.
Should XRP price follow the projected Elliott Wave pattern, James Crypto’s forecast points to a supercycle top expected to occur in March to April 2024. The target price range for XRP during this period is estimated to be between $5 and $13.
Struggles Amidst Price Declines
Trading at $0.6147, XRP has experienced a decline of 0.5%, 1.4%, and 4.3% over the past 24 hours, seven days, and fourteen days, respectively. These downward trends highlight the token’s current lack of bullish momentum and catalyst.
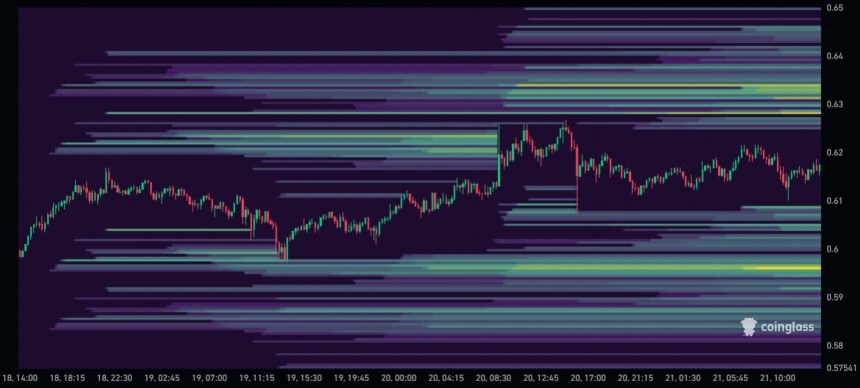
CoinGlass’ liquidation heatmap indicates a critical juncture for XRP’s price, as significant leveraged positions exist on both sides of the market. The heatmap reveals notable liquidations at the $0.6284 and $0.6347 levels, with the largest amount observed at $0.5960 over the past three days.
Considering these developments, XRP may initially break through the long liquidation level before experiencing another upward movement to bolster much-needed bullish momentum.
However, given the unpredictable nature of volatility and price actions, a short squeeze could potentially occur first, temporarily driving the XRP price above its nearest resistance levels.
The outcome remains uncertain as to which side will yield first and what additional catalysts may contribute to a price surge for XRP, aligning it with the overall market trend of gains as we approach the end of the year.
Featured image from Shutterstock, chart from TradingView.com
Disclaimer: The article is provided for educational purposes only. It does not represent the opinions of NewsBTC on whether to buy, sell or hold any investments and naturally investing carries risks. You are advised to conduct your own research before making any investment decisions. Use information provided on this website entirely at your own risk.
- SEO Powered Content & PR Distribution. Get Amplified Today.
- PlatoData.Network Vertical Generative Ai. Empower Yourself. Access Here.
- PlatoAiStream. Web3 Intelligence. Knowledge Amplified. Access Here.
- PlatoESG. Carbon, CleanTech, Energy, Environment, Solar, Waste Management. Access Here.
- PlatoHealth. Biotech and Clinical Trials Intelligence. Access Here.
- Source: https://www.newsbtc.com/xrp-news/xrp-price-forecast-wave-5-signals-impending-supercharged-growth-to-13-by-2024/

