SNEAK PEEK
- Bears nosedive XRP price to a 7-day low in the last 24 hours.
- The 24-hour trading volume increase indicates sustained demand despite the dip.
- Kelter Channel’s linear motion foreshadows a narrow price range ahead.
The XRP market worsened over the past 24 hours, with prices falling from an intraday high of $0.4396 to a 7-day low of $0.4186 due to the bearish dominance. During this dip, according to data provided by the whale alert team on May 9th, 31,000,000 (13,131,141 USD) worth of XRP was transferred from an unidentified wallet to Bitstamp.
🚨 31,000,000 #XRP (13,131,141 USD) transferred from unknown wallet to #Bitstamphttps://t.co/wmyxEhFo4D
— Whale Alert (@whale_alert) May 8, 2023
At the time of writing, the XRP price had dropped by 3.71% to $0.4221 from the previous close.
Due to the recession, XRP’s market capitalization dropped by 3.74% to $21,881,959,868, while the 24-hour trading volume increased by 47.30% to $1,136,926,019. This move indicates that there is still significant interest and demand for XRP among traders and investors despite the recent price drop.
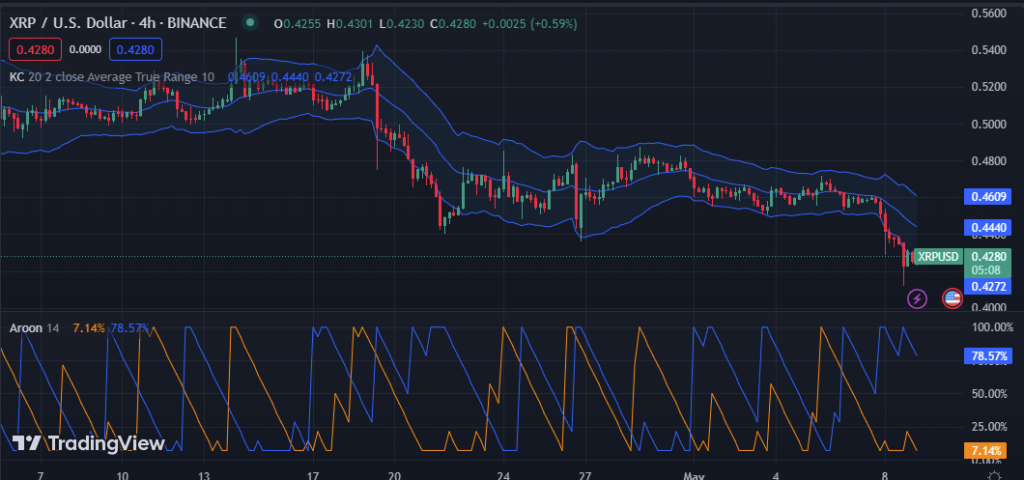
On the XRP 4-hour price chart, the upper and lower Kelter Channel readings are 0.4608 and 0.4266, respectively. This movement suggests that the price is likely to remain within a relatively narrow range for the time being, with neither significant upward nor downward movements anticipated soon.
The movement of red candlesticks on the lower band, however, indicates a prolonged bearish trend in the market, cautioning traders to liquidate their holdings or wait for a better entry point.
According to readings of 7.14% and 78.57% on the Aroon up and down, respectively, the market is currently experiencing bearish momentum, with sellers controlling the market and driving prices lower. The likelihood of further price declines may lead traders to view this as a signal to short or sell their positions.
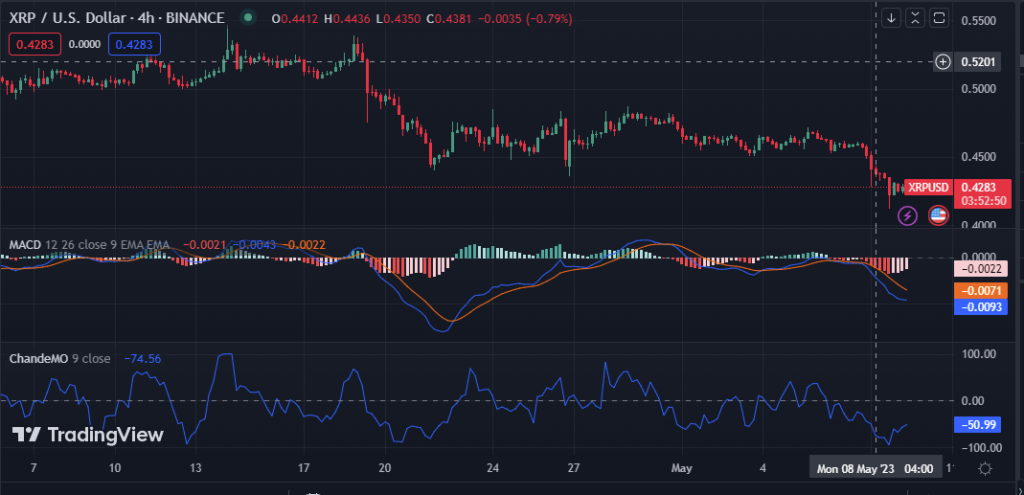
On the 4-hour price chart of the XRP market, the MACD blue line moves into negative territory and below the signal line with a value of -0.0092, indicating that the market is becoming more bearish. This move could indicate a potential downward trend for XRP in the short term, as sellers may be taking control of the market.
With a value of -50.88, the Chande Momentum Oscillator (ChandeMO) enters the negative zone on the 4-hour price chart of the XRP market, indicating that sellers are in charge and the market is on the decline.
In conclusion, XRP prices have fallen due to bears dominating the market, with sellers controlling and lowering prices. Traders should consider this a warning sign to liquidate their holdings or wait for a better entry point.
Disclaimer: Cryptocurrency price is highly speculative and volatile and should not be considered financial advice. Past and current performance is not indicative of future results. Always research and consult with a financial advisor before making investment decisions.
- SEO Powered Content & PR Distribution. Get Amplified Today.
- PlatoAiStream. Web3 Data Intelligence. Knowledge Amplified. Access Here.
- Minting the Future w Adryenn Ashley. Access Here.
- Buy and Sell Shares in PRE-IPO Companies with PREIPO®. Access Here.
- Source: https://investorbites.com/xrp-price-analysis-05-09/

