This week, financial markets are focused on the FOMC interest rate decision, as well as key economic indicators such as CPI and PPI. The Fed’s decision comes on the heels of rate cuts by the ECB and BOC, with expectations of a hold on rates in June. Investors are also looking for signals from the Bank of Japan amidst the Yen’s historic lows. In this context, we analyze market expectations and recent price actions, particularly focusing on EUR/USD and USD/JPY, which has shown resilience with a decade-long uptrend.
FOMC Meeting and Key Economic Indicators: Awaiting the Fed’s Decision
This week, the financial world is waiting with anticipation for the FOMC interest rate decision, statement, press conference, and the dot plot. This follows rate cuts by both the European Central Bank (ECB) and the Bank of Canada (BOC), each by 25 basis points, in response to declining inflation.
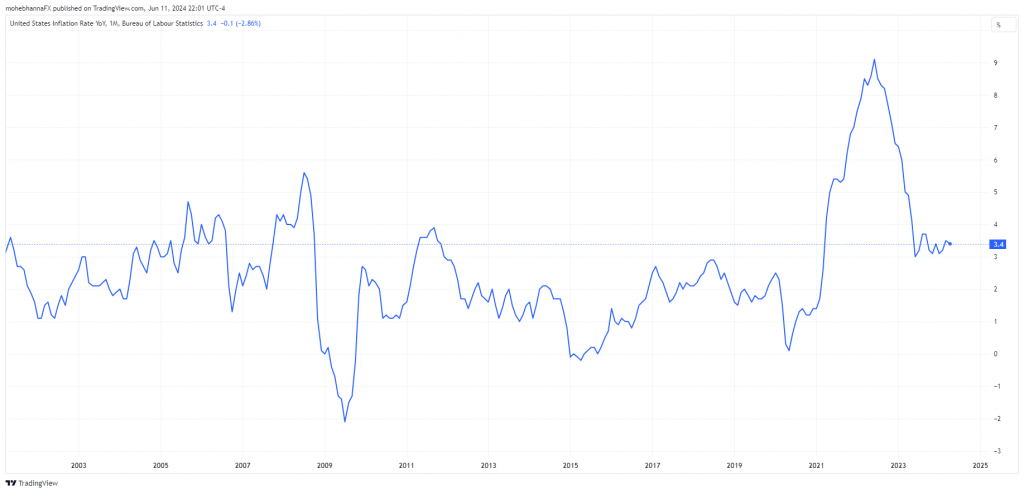
In the US, inflation has significantly decreased from its 2022 peak. However, recent CPI and PCE readings indicate persistent inflation in sectors like housing and services. Fed Chair Jerome Powell has emphasized that any future rate cuts hinge on sustained disinflation. Other Fed officials echo these concerns.
Bloomberg analyst surveys, media polls, and CME Group data suggest the Fed will maintain the current 525-550 interest rate in June. Traders now anticipate only two rate cuts in 2024, starting in September, a shift influenced by robust job numbers. Market participants are also keen to see updates in this quarter’s dot plot, particularly regarding the projected rate cuts for 2024.
The upcoming Consumer Price Index (CPI) report, expected to be released on the same day as the FOMC meeting, is also in the spotlight. Forecasts suggest CPI Y/Y will remain at 3.4%, with Core CPI Y/Y also holding steady at 3.6%. CPI M/M is projected to dip to 0.1% from 0.3%, likely due to falling oil prices. The services sector, a recent concern, has shown signs of stabilization within Core CPI. Additionally, a noted increase in medical services costs has brought prices back to their averages.The timing of the CPI report’s release during the FOMC meeting adds another layer of intrigue, as traders and the Fed navigate this uncommon scenario.
The PPI report is due this week, with expectations of a decline in both PPI M/M and Core PPI M/M. Similar to CPI, the services component of PPI has risen since January 2024, returning to pre-COVID levels.
Bank of Japan Expected to Hold Rates Amidst Yen’s Weakness
Meanwhile, later in the week, the Bank of Japan (BOJ) is expected to maintain its current interest rate of 0.10%. However, traders will be watching for any signs of quantitative tightening (QT), which could impact the market. The Japanese Yen, currently trading near a 34-year low, adds another element of uncertainty. Despite the interest rate differential between the US and Japan, carry trades on USDJPY remain attractive to some investors, albeit with inherent risks.
EUR/USD Technical Analysis – Daily Chart
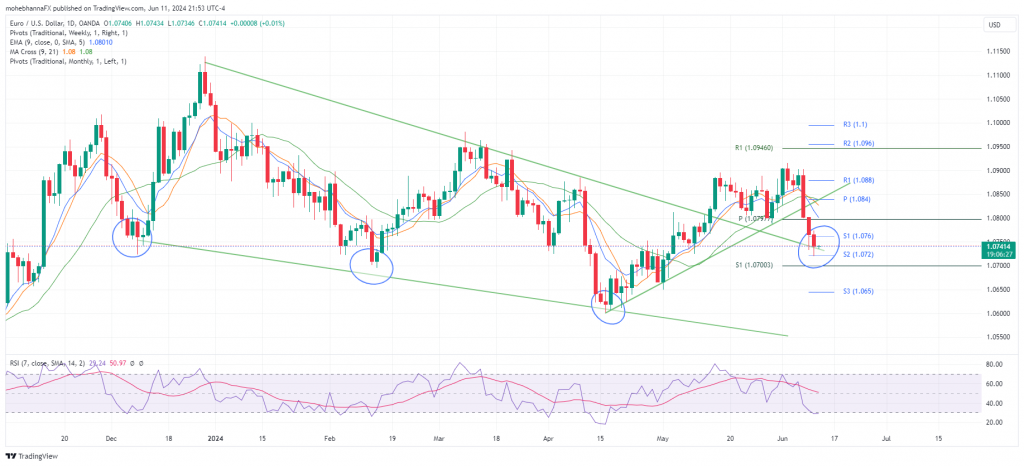
- Price action broke out and closed above the upper border of the narrowing formation identified on the above chart, two throwbacks took place as well as a shortfall as the price found support above a confluence of support, represented by monthly PP and Weekly support S1 near 1.0797.
- However, last week Non-Farm Payroll surprised the markets with higher-than-expected numbers, this caused price action to complete a third throwback which took price action back to the same border discussed on the above point.
- Price action broke and closed below three moving averages: EMA9, MA9, and MA21.
- Non-smoothed RSI7 aligns with price action and is currently at oversold territory.
- The potential double bottom formation (or triple bottom) discussed last time has materialized and still has potential as price found support above the resistance line connecting the three bottoms, if price action fails above this line and trades within the narrowing formation, the pattern may be invalidated.
- Weekly Chart update: Price action remains below the lower border of the previously discussed ascending channel; multiple pullback attempts have failed so far, and price continues to trade below the pattern.
- Monthly Chart update: Last month candle was a bullish engulfing candle after price rallied where it was met by resistance at its annual pivot point of 1.0920, taking price action down to 1.0760 where it found support above its intermediate MA21.
USD/JPY Technical Analysis – Daily Chart
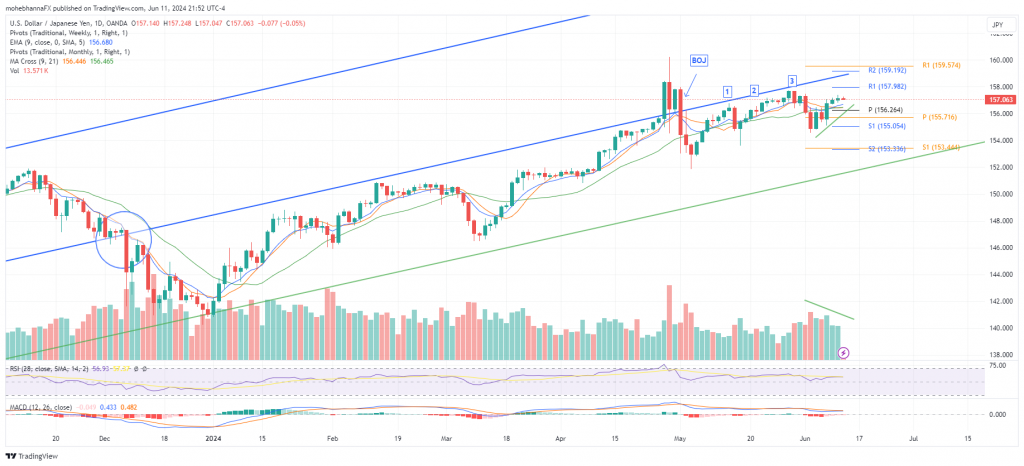
- The USD/JPY price has demonstrated remarkable resilience, maintaining an extended uptrend for over ten years. The latter part of the uptrend, influenced by the fundamental economies of the USA and Japan, is marked by the blue lines on the chart. Price action was trading within an ascending channel; it broke below the channel’s lower border during late 2023. However, it has been attempting to re-enter the channel since the breakout. (Unchanged from last week)
- Following the latest 2024 Bank of Japan meeting, price action was able to break above the channel’s lower border and reenter. However, the break was met by fierce resistance represented by a strong bearish engulfing candle, which closed below the lower border by the end of the trading day.
- Following the failed breakout, Price action has attempted three pullbacks, and was met by resistance for every attempt so far as indicated on the chart, on all occasions, price action has failed to enter the channel again, formed bearish engulfing candles and shortfalls as price action was met by resistance at its last week PP of 157.12.
- Price broke below a confluence of moving averages; however, it didn’t last long as price reversed back up and closed above the three averages as well as this week’s pivot point of 156.26, a break and a close below this level may invalidate the recent upside price move.
- Negative Divergence between the latest upside move and tick volume as price rose on a declining volume.
- Fast RSI7 still aligns with price action and has reversed from overbought territory.
Conclusion
In conclusion, market participants are keenly awaiting the FOMC’s interest rate decision and the release of key economic indicators, particularly CPI. The Fed’s decision, alongside potential policy shifts from the Bank of Japan, will significantly influence currency markets. Technical analysis of EUR/USD and USD/JPY suggests potential volatility and highlights key levels to watch. Traders should closely monitor these events and indicators for potential trading opportunities, while also considering the broader economic context and geopolitical risks.
Content is for general information purposes only. It is not investment advice or a solution to buy or sell securities. Opinions are the authors; not necessarily that of OANDA Business Information & Services, Inc. or any of its affiliates, subsidiaries, officers or directors. If you would like to reproduce or redistribute any of the content found on MarketPulse, an award winning forex, commodities and global indices analysis and news site service produced by OANDA Business Information & Services, Inc., please access the RSS feed or contact us at info@marketpulse.com. Visit https://www.marketpulse.com/ to find out more about the beat of the global markets. © 2023 OANDA Business Information & Services Inc.
- SEO Powered Content & PR Distribution. Get Amplified Today.
- PlatoData.Network Vertical Generative Ai. Empower Yourself. Access Here.
- PlatoAiStream. Web3 Intelligence. Knowledge Amplified. Access Here.
- PlatoESG. Carbon, CleanTech, Energy, Environment, Solar, Waste Management. Access Here.
- PlatoHealth. Biotech and Clinical Trials Intelligence. Access Here.
- Source: https://www.marketpulse.com/newsfeed/us-cpi-and-fomc-rate-decision-eur-usd-and-usd-jpy-technical-analysis/mhanna


