The pioneer cryptocurrency, Bitcoin, has struggled to hold above the $43,000 price mark over the past few weeks. The last seven days have not been much different for the cryptocurrency, which currently trades below $42,000.
However, a popular crypto analyst on the X platform has come forward with an interesting trajectory for the price of BTC in the coming weeks. Based on his projection, investors could see the market leader trade above the psychological $50,000 level – but there is a caveat.
BTC Price To $50,000 – But What Happens After?
In a recent post on X, prominent crypto trader Ali Martinez put forward a price prediction, stating that Bitcoin’s value could climb as high as $50,000 in the near future. The analyst came up with this projection after identifying and studying a historical pattern on the coin’s price chart on a higher timeframe.
Martinez’s prediction is based on BTC’s price action between 2016 and 2019 on the weekly chart. According to the crypto analyst’s post, the premier cryptocurrency witnessed a major price correction – after reaching a market bottom – when it touched the 0.786 Fibonacci retracement level.
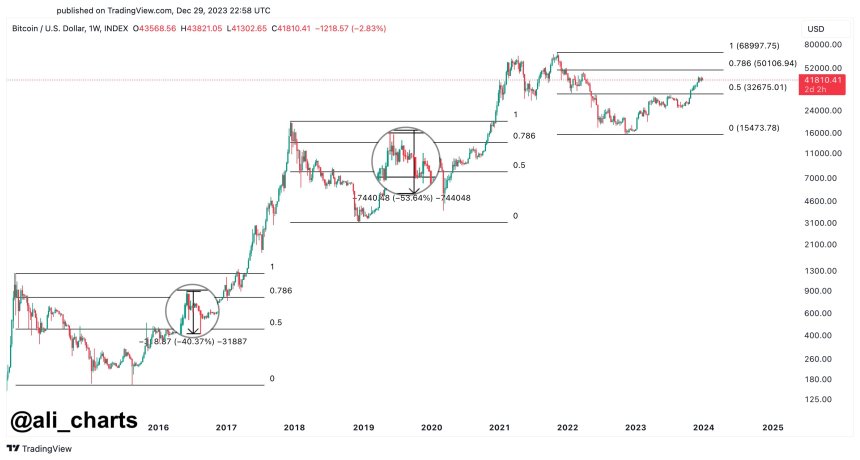
A weekly chart showing Bitcoin's price movement between 2016 -2023 | Source: Ali_charts/X
Martinez believes that current price action mirrors the Bitcoin pattern observed in the last years of the previous decade. Historical price patterns can be helpful in technical analysis and in predicting the future trajectory of a cryptocurrency.
If this history – on the Bitcoin price chart – does repeat itself, investors could see the value of BTC surge toward $50,000. However, Ali Martinez noted that the flagship cryptocurrency could come tumbling down afterward by a significant 40%.
From the current price point, Bitcoin’s journey to $50,000 would mean an almost 20% upward swing. Meanwhile, a 40% decline right after this surge could see the premier cryptocurrency return to around $30,000.
Bitcoin Price Overview
As of this writing, the value of Bitcoin stands at $41,831, representing a 1.5% price decline in the past 24 hours. This recent dip only further reflects the bearish pressure the market leader has had to face in the past week.
According to data from CoinGecko, the Bitcoin price is down by nearly 4% in the last seven days. However, the cryptocurrency has had a fairly successful December, having increased by about 10% in the last month of 2023.
BTC has had one of the best price performances this year, soaring by an outstanding 150% since January. Consequently, Bitcoin retains its spot as the largest cryptocurrency in the sector, with a market capitalization of roughly $823 billion.
Bitcoin price continues to move sideways on the daily timeframe | Source: BTCUSDT chart on TradingView
Featured image from iStock, chart from TradingView
Disclaimer: The article is provided for educational purposes only. It does not represent the opinions of NewsBTC on whether to buy, sell or hold any investments and naturally investing carries risks. You are advised to conduct your own research before making any investment decisions. Use information provided on this website entirely at your own risk.
- SEO Powered Content & PR Distribution. Get Amplified Today.
- PlatoData.Network Vertical Generative Ai. Empower Yourself. Access Here.
- PlatoAiStream. Web3 Intelligence. Knowledge Amplified. Access Here.
- PlatoESG. Carbon, CleanTech, Energy, Environment, Solar, Waste Management. Access Here.
- PlatoHealth. Biotech and Clinical Trials Intelligence. Access Here.
- Source: https://www.newsbtc.com/bitcoin-news/this-bitcoin-historical-pattern-could-send-price-to-50000-before-major-correction-analyst/

