SNEAK PEEK
- RNDR experiences impressive rally and secures top market cap spot.
- Investor activity remains robust despite price correction.
- Bears dominate the RNDR market, but a bullish turnaround is possible.
RenderToken (RNDR) has experienced an impressive price rally, surging by +63% in the past 12 days. This remarkable performance has propelled RNDR to secure the #45 spot among the top market caps in the cryptocurrency realm.
💽 The +63% price rally by @RenderToken over the past 12 days has moved it up to the #45 spot on the top market caps in #crypto. Our latest insight takes a look at its latest big day, shark & whale behavior, and how the crowd will likely dictate the top. https://t.co/mv5XYBFnP2 pic.twitter.com/z2Z4OBIsEB
— Santiment (@santimentfeed) May 23, 2023
The bullish momentum continued within the last 24 hours, pushing the RNDR price to a 7-day high of $2.79. However, this ascent was met with solid resistance, causing a temporary setback. As a result, the market witnessed a 2.48% dip, with RNDR dropping to $2.55 at press time.
Despite this correction, investor activity remained robust. The market capitalization experienced a marginal decline of 2.53% to reach $932,291,586. Nevertheless, the 24-hour trading volume surged by an impressive 20.90% to $251,299,671. This noteworthy increase in trading volume indicates that investors are actively participating in the market, remaining hopeful for a potential rebound.
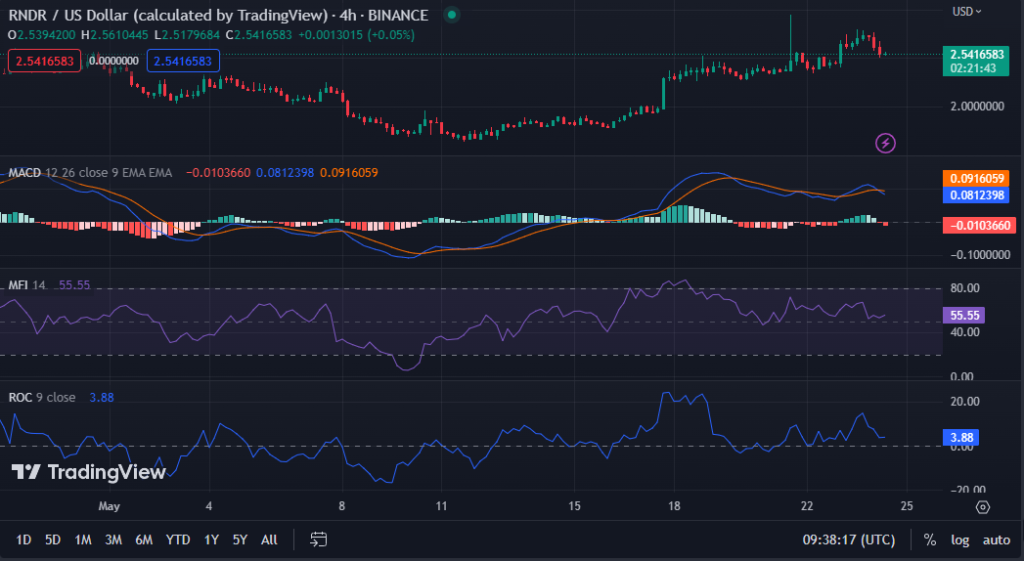
RNDR/USD Technical Analysis
With a value of 0.0825127, the MACD line has fallen below its signal line, indicating profit-taking in the RNDRUSD market. This and the histogram movement in the negative zone suggest that bears are now in charge of the market.
The Money Flow Index rating of 55.57 indicates that some purchasing pressure remains in the market, but it is insufficient to overcome the negative attitude. Profitable traders may consider placing sell orders at critical resistance levels. If the MFI falls below 50, it may signal a move toward selling pressure and a possible decline.
With a rate of change of 4.20, the RNDR market’s bearish movement may continue in the near term. This anticipation is because the RNDR price chart’s ROC level shows momentum favoring the bears. However, since it is still in a positive zone, there is still the possibility of a bullish turnaround in the near future.
In conclusion, RNDR’s impressive price rally faces temporary resistance, but investor activity and trading volume remain high, suggesting potential for a rebound.
Disclaimer: Cryptocurrency price is highly speculative and volatile and should not be considered financial advice. Past and current performance is not indicative of future results. Always research and consult with a financial advisor before making investment decisions.
- SEO Powered Content & PR Distribution. Get Amplified Today.
- PlatoAiStream. Web3 Data Intelligence. Knowledge Amplified. Access Here.
- Minting the Future w Adryenn Ashley. Access Here.
- Buy and Sell Shares in PRE-IPO Companies with PREIPO®. Access Here.
- Source: https://investorbites.com/rendertoken-rndr-price-analysis-05-24/

