SNEAK PEEK
- BTC’s steady $29.4k performance outpaces equities, boosting confidence.
- The correlation shift highlights growing investor faith in crypto’s uniqueness.
- Bears dominate, yet BTC’s trading activity endures amidst market shifts.
Bitcoin continues to trade within a limit range at $29.4k, but this flat performance in August outperforms equity markets such as the #SP500. The break in correlation that began in mid-July has historically been positive for cryptocurrency prices.
? #Bitcoin continues to stay in a tight price range at $29.4k, but this flat behavior is actually outperforming equities markets like the #SP500 here in August. The correlation break that began in mid-July is historically beneficial to #crypto prices. https://t.co/94iKuzxhP6 pic.twitter.com/WFE7HJ0ys6
— Santiment (@santimentfeed) August 16, 2023
Over this period, Bitcoin has showcased its resilience by maintaining stability even when the market experiences fluctuations. This correlation divergence suggests that investors are progressively acknowledging cryptocurrencies as a distinct asset class, boosting their confidence in Bitcoin’s long-term potential.
Nonetheless, bears have dominated the Bitcoin market over the past 24 hours, driving prices from an intraday high of $29,439.12 to an intraday low of $29,088.85. BTC’s price was down 0.63 % during this writing to $29,151.06 from its previous close.
Amidst the economic downturn, the market capitalization of BTC saw a slight decline of 0.59%, settling at $567,246,024,433. Interestingly, the trading volume within 24 hours increased by 8.80%, reaching a value of $13,364,742,719. This change highlights that even though the market capitalization of BTC decreased, there remained noteworthy trading engagements in the BTC market.
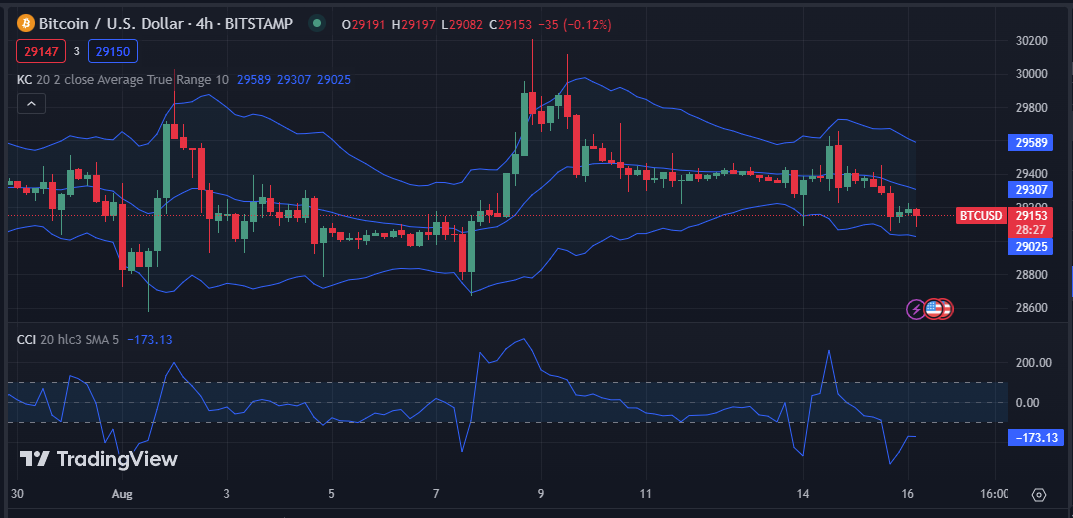
The upper and lower Kelter Channels (KC) values on the BTC market price chart are 29589 and 29025, respectively. This movement indicates that the market is undergoing a significant decline. If the price breaches the bottom line, the downward trend may continue and provide opportunities for profit-taking or short-selling.
On the 4-hour price chart for BTC, the negative Commodity Channel Index (CCI) with its line pointing south has a value of -173.13. This movement suggests that the market is experiencing intense selling pressure and that a price reversal is imminent. BTC’s price is currently in a dip, but a price increase may be on the horizon.
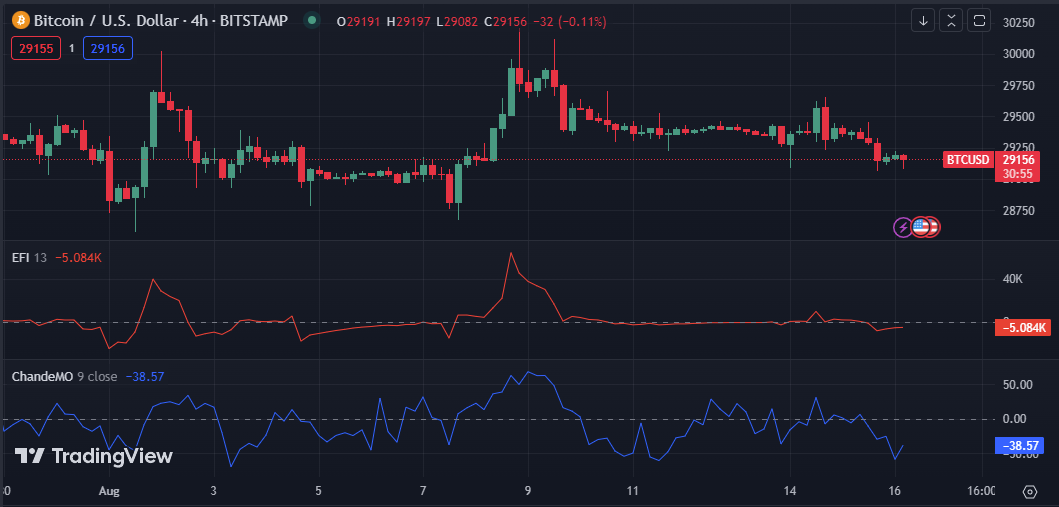
The Chande Momentum Oscillator (ChandeMO) on the BTC market’s 4-hour price chart is negative and pointing south with a value of -38.57. This movement indicates that BTC has been falling rapidly on the market and may be due for a brief rebound because it is currently oversold.
The Elder Force Index (EFI) is negative with a value of -5,084k on the 4-hour price chart for BTC, indicating increased selling pressure in the market, which may portend a continuation of the bearish trend. Even though the price of Bitcoin has decreased, a significant price increase may be imminent.
In conclusion, intriguing dynamics unfold as Bitcoin’s resilience defies norms. Amid fluctuations, its potential remains strong in an evolving market landscape.
Disclaimer: Cryptocurrency price is highly speculative and volatile and should not be considered financial advice. Past and current performance is not indicative of future results. Always research and consult with a financial advisor before making investment decisions.
- SEO Powered Content & PR Distribution. Get Amplified Today.
- PlatoData.Network Vertical Generative Ai. Empower Yourself. Access Here.
- PlatoAiStream. Web3 Intelligence. Knowledge Amplified. Access Here.
- PlatoESG. Carbon, CleanTech, Energy, Environment, Solar, Waste Management. Access Here.
- PlatoHealth. Biotech and Clinical Trials Intelligence. Access Here.
- Source: https://investorbites.com/bitcoin-btc-price-analysis-16-08/

