- The pair USDCHF managed to initiate a bullish consolidation after the fall to the 0.89535 level on Monday.
- This week, USDJPY started at the 149.36 level, and from there, we started a bullish consolidation.
USDCHF chart analysis
The pair USDCHF managed to initiate a bullish consolidation after the fall to the 0.89535 level on Monday. This week’s high price was formed this morning at the 0.90465 level. At that level, we encounter resistance and the pair retreats to the 0.90200 level. Looking at the charts, we could expect to see a pullback to the 0.90100 level, where we encounter the EMA50 moving average. If we get support in that zone, we could start a new bullish consolidation again.
Potential higher targets are 0.90500 and 0.90600 levels. For a bearish option, we need a negative consolidation and a drop below the EMA50 and .90100 levels. After that, we go down to test the 0.90000 level. A break below leads to the formation of a new low, and there is an increase in bearish pressure on the dollar. Potential lower targets are 0.89900 and 0.89800 levels.

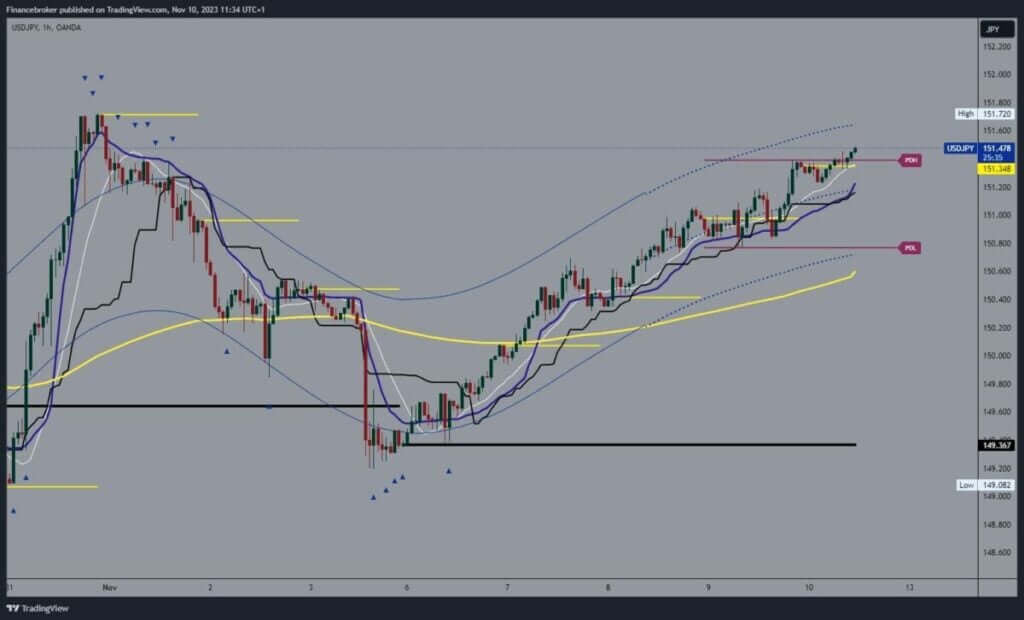
USDJPY chart analysis
This week, USDJPY started at the 149.36 level, and from there, we started a bullish consolidation. On Tuesday, we climbed above the 150.00 level and managed to stay above it. Then, we see a continuation of the consolidation and a break above the 151.00 level yesterday. During the Asian trading session, the pair moved around the 151.25 level, and at the beginning of the EU session, we saw a breakthrough above the Asian high and thus formed a new high at the 151.50 level.
The next target is last week’s high at 151.72 level, then 152.00 level. We need a negative consolidation and pullback below the 151.20 level for a bearish option. After that, we tested the 151.00 level again. A break below leads to increased bearish pressure, and we will see a further pullback in USDJPY. Potential lower targets are 150.80 and 150.60 levels.
.embed_code iframe {
height: 325px !important
}
.embed_code p { margin-top: 18%; text-align: center;
}
.embed_code { height: 370px; width: 80%; margin: auto;
}
.embed_code h2{ font-size: 22px;
}
BONUS VIDEO: Weekly news summary from the markets
[embedded content]
- SEO Powered Content & PR Distribution. Get Amplified Today.
- PlatoData.Network Vertical Generative Ai. Empower Yourself. Access Here.
- PlatoAiStream. Web3 Intelligence. Knowledge Amplified. Access Here.
- PlatoESG. Carbon, CleanTech, Energy, Environment, Solar, Waste Management. Access Here.
- PlatoHealth. Biotech and Clinical Trials Intelligence. Access Here.
- Source: https://www.financebrokerage.com/usdchf-and-usdjpy-usdjpy-is-climbing-above-the-151-00/

