United States 10-year Treasury yields soared above 4.8% on Oct. 3, their highest level since 2007. DoubleLine Capital CEO Jeffrey Gundlach said in a post on X (formerly Twitter) that the spread between the 2-year and 10-year Treasury yields has narrowed from 109 basis points a few months ago to 35 basis points. He cautioned that this “should put everyone on recession warning.”
Arthur Hayes, former CEO of crypto exchange BitMEX, warned in a recent X thread that the government will have to print money to save the bond market as a faster bear steepener — a condition where long-term interest rates rise more quickly than short-term rates — will cause firms to collapse. Some investors believe that this could trigger a cryptocurrency bull market.

It also looks like the institutional investors have started to warm up to cryptocurrencies. CoinShares’ latest Digital Asset Fund Flows Weekly Report shows inflows of $21 million into digital asset investment products for the first time in six weeks.
In this uncertain macro environment, let’s take a look at the charts to determine the next potential move.
Bitcoin price analysis
Bitcoin (BTC) rose above $28,143 on Oct. 2 but the long wick on the candlestick shows the bears are aggressively selling at higher levels. The bears tried to build upon their advantage on Oct. 3 but the bulls held their ground at $27,160.

The upsloping 20-day exponential moving average ($26,903) and the relative strength index (RSI) in the positive territory indicate that bulls have the upper hand. Buyers will once again try to clear the overhead resistance at $28,143.
A close above this level will complete a short-term double bottom pattern, which has a target objective of $31,486.
This positive view will be invalidated if the price once again turns down from the overhead resistance and plummets below the 20-day EMA. That could yank the price to $26,000. The BTC/USDT pair could then continue to consolidate between $24,800 and $28,143 for a while longer.
Ether price analysis
Ether (ETH) turned down sharply from the overhead resistance of $1,746 on Oct. 2, indicating that the bears are fiercely guarding this level.

The 20-day EMA ($1,640) is flattening out and the RSI is near the midpoint, indicating a balance between supply and demand. If the price turns up from the current level, the bulls will again try to overcome the obstacle at $1,746. If they can pull it off, the ETH/USDT pair will complete a double bottom pattern, having a target objective of $1,961.
On the other hand, if the price continues lower and tumbles below the moving averages, it will suggest that the pair may extend its stay inside the $1,531 to $1,746 range for some more time.
BNB price analysis
BNB (BNB) jumped above the $220 resistance on Oct. 2 but the bulls could not sustain the breakout as seen from the long wick on the day’s candlestick.

The failure of the bulls to maintain the price above the 20-day EMA ($214) is a negative sign. It shows that traders are rushing to the exit. The BNB/USDT pair could next fall to the uptrend line.
If the price rebounds off this level, the bulls will again try to push the pair above $220. A close above this resistance could signal the start of an up-move to $235 and thereafter to $250. Instead, if the price breaks below the uptrend line, the pair may decline to the formidable support at $203.
XRP price analysis
Buyers pushed XRP (XRP) above the symmetrical triangle pattern on Sep. 29 and then foiled several attempts by the bears to pull the price back into the triangle.

The bulls will next try to surmount the overhead resistance at $0.56. If they are successful, it will signal the start of a new uptrend. The XRP/USDT pair could then start its journey toward the pattern at $0.66.
Conversely, if the price turns down from $0.56 and dives below the uptrend line, it will suggest that the bulls are booking profits. That could keep the pair range-bound between $0.56 and $0.41 for a few more days.
Solana price analysis
Solana (SOL) has been oscillating inside a large range between $14 and $27.12. The price action of the past few days has resulted in the formation of a potential inverse head and shoulders pattern.

Although setups formed inside a range tend to be less reliable, still they should not be neglected. If the price turns up and breaks above the neckline, the SOL/USDT pair could attempt a rally to $27.12 and eventually to the pattern target of $32.81.
The critical support to watch on the downside is the 20-day EMA ($20.95). If the price slides below this level, it will suggest that the bulls have given up. That could open the gates for a possible drop to $17.33.
Cardano price analysis
Cardano (ADA) turned down from $0.27 on Oct. 2 and reached the 20-day EMA ($0.25) on Oct. 4. This is an important level to keep an eye on in the near term.

If the price rebounds off the 20-day EMA, it will indicate a change in sentiment from selling on rallies to buying on dips. The bulls will then try to shove the price above $0.27 and start an up-move to $0.29 and later to $0.32.
If bears want to prevent the rally, they will have to drag the price below the 20-day EMA. The ADA/USDT pair may then once again descend to the vital support at $0.24. The bulls are likely to protect this level with vigor.
Dogecoin price analysis
The bulls pushed Dogecoin (DOGE) above the 50-day SMA ($0.06) on Oct. 2 but could not sustain the higher levels. This suggests that bears are selling on every minor relief rally.
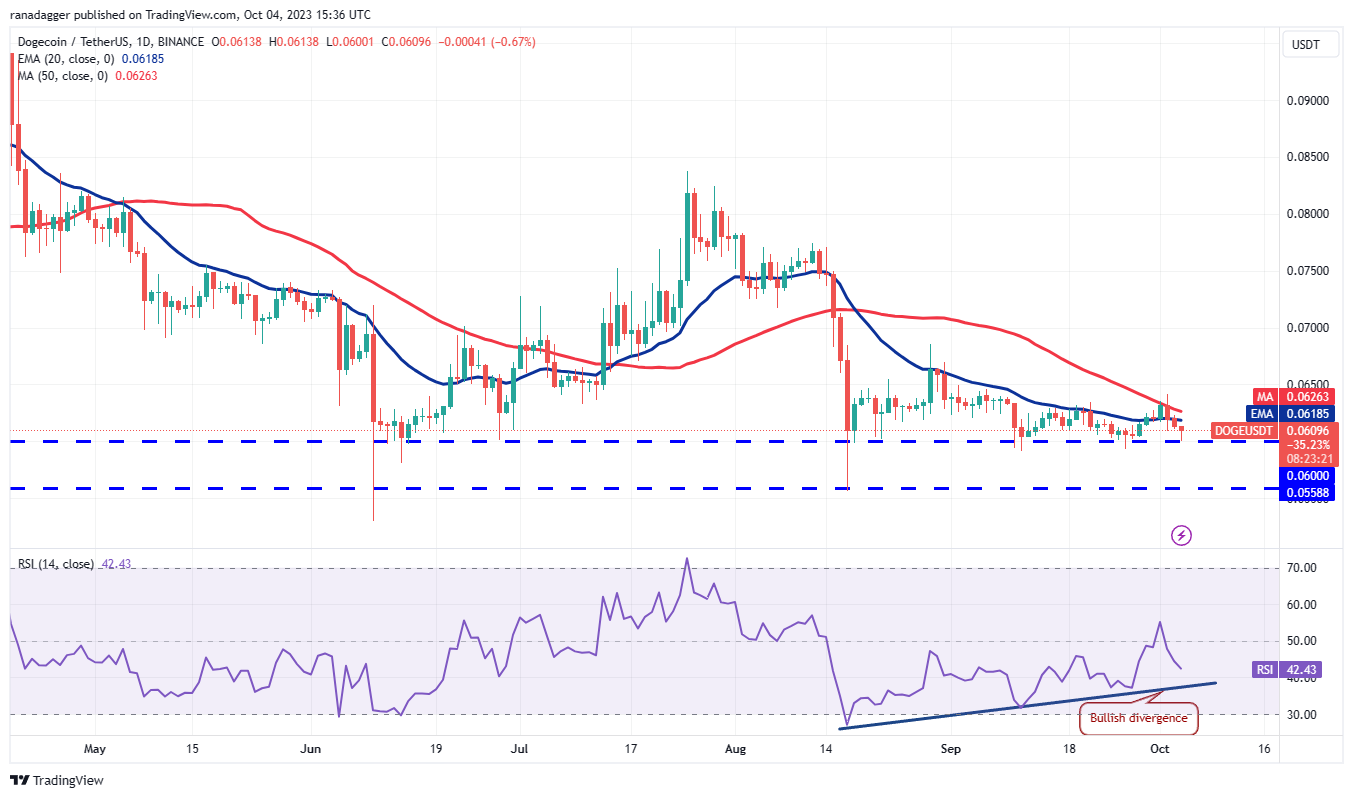
The DOGE/USDT pair has reached the formidable support at $0.06. The repeated retest of a support level within a short interval tends to weaken it. If the $0.06 level cracks, the pair may slump to the next major support at $0.055.
A minor advantage in favor of the buyers is that the RSI has formed a bullish divergence. This suggests the bears may be losing their grip. The indicators are not providing clarity about the next move. Hence, it is best to wait for the price to close above the 50-day SMA or plunge below $0.06 to place directional bets.
Related: Bitcoin traders hope $27K holds as BTC price ignores volatile US dollar
Toncoin price analysis
Toncoin (TON) fell below the 20-day EMA ($2.09) on Sep. 30 and the bears thwarted attempts by the bulls to reclaim the level on Oct. 1.

The bears are trying to solidify their position by sinking the price to the 50-day SMA ($1.86). This level may result in a rebound that is likely to face selling at the 20-day EMA.
If the price turns down from this resistance, it will suggest that the sentiment has turned bearish and traders are selling on rallies. That will increase the likelihood of a drop below the 50-day SMA.
On the contrary, if the price turns up and surges above the 20-day EMA, it will suggest that the markets have rejected the lower levels. The TON/USDT pair could then rise to $2.32 where the bears will again try to halt the up-move.
Polkadot price analysis
Polkadot (DOT) turned down sharply from the 50-day SMA ($4.24) on Oct. 2 and broke below the 20-day EMA ($4.10) on Oct. 3.

The bears challenged the important support at $3.91 on Oct. 4 but the long tail on the candlestick shows strong buying at lower levels. The RSI has formed a bullish divergence, indicating that the sellers may be losing their grip.
If the bulls push the price above the 20-day EMA, it will suggest that the DOT/USDT pair may extend its stay inside the $4.33 to $3.91 range for some more time. The bears will have to sink the price below $3.91 to start the next leg of the downtrend to $3.50.
Polygon price analysis
After witnessing a tough battle between the bulls and the bears near the moving averages, Polygon (MATIC) bounced on Oct. 4, indicating that buyers are trying to take charge.

The bulls are trying to build upon the strength and propel the price above the overhead resistance at $0.60. If they manage to do that, it will signal the start of a sustained recovery. The MATIC/USDT pair could then rise to $0.70.
Contrary to this assumption, if the price turns down and breaks below the 20-day EMA, it will indicate that the bears are active at higher levels. The pair may then retest the crucial support at $0.49. This level is likely to attract solid buying by the bulls.
This article does not contain investment advice or recommendations. Every investment and trading move involves risk, and readers should conduct their own research when making a decision.
- SEO Powered Content & PR Distribution. Get Amplified Today.
- PlatoData.Network Vertical Generative Ai. Empower Yourself. Access Here.
- PlatoAiStream. Web3 Intelligence. Knowledge Amplified. Access Here.
- PlatoESG. Carbon, CleanTech, Energy, Environment, Solar, Waste Management. Access Here.
- PlatoHealth. Biotech and Clinical Trials Intelligence. Access Here.
- Source: https://cointelegraph.com/news/price-analysis-10-4-btc-eth-bnb-xrp-sol-ada-doge-ton-dot-matic

