Polkadot (DOT), a prominent player in the blockchain ecosystem, is currently experiencing a dramatic decline, prompting a bearish alert. The cryptocurrency is in freefall, with its price plummeting towards new lows. A combination of market-wide volatility, negative investor sentiment, and regulatory pressures fuels this sharp downturn. As DOT’s value continues to erode, investors are advised to brace for further losses and reassess their strategies in light of these bearish signals.
In this analysis, we will dive into Polkadot’s price prospects with the help of some technical indicators focusing on the 1-hour and the 4-hour timeframe.
DOT Price Still Actively Bearish
DOT’s price on the 4-hour chart did a retracement after a break from the previous bearish triangle wedge and began to drop again. Although the price currently is attempting to move up, the reality is that it will continue to drop afterward.
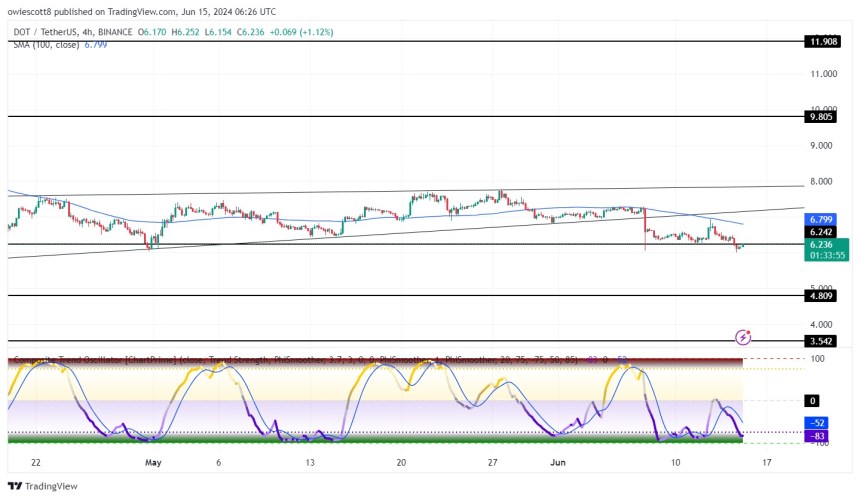
The formation of the 4-hour Composite Trend Oscillator also suggests that the price of DOT may still drop as the signal line and Simple Moving Average (SMA) of the indicator are currently trending close to the oversold zone.
Also, on the 1-day chart, DOT is attempting a bullish move below the 100-day SMA after dropping a bearish candlestick on the past day. Based on the 1-day price formation, it can be suggested that this bullish move that DOT is making is just on a short-term note.
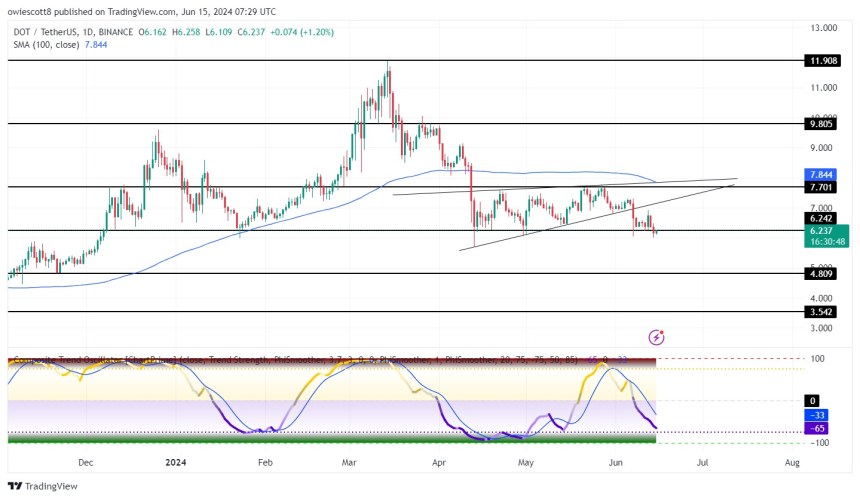
Lastly, the 1-day Composite Trend Oscillator on the daily chart signals that DOT’s price is still actively bearish as both the signal line and SMA have crossed below the zero line and are heading towards the oversold zone.
More Losses Ahead?
In conclusion, Polkadot is currently in a precarious position as it experiences a sharp and sustained decline, triggering a bearish alert. Therefore, if the price of DOT continues to drop, it might move towards the $4.809 support level. And if it breaks below this level it will drop further to test the $3.542 support level and probably other key levels afterward.
However, if DOT decides to continue its move in the upward direction, it will begin to move toward the $7.701 resistance level. Should it move above this level, it will move higher to test the $9.805 level and probably go bullish to test other key levels.
As of the time of writing, DOT was trading at around $6.23 and was down by 2.58% with a market capitalization of over $8.9 billion and a 24-hour trading volume of over $204 million. Although its market capitalization is down by 2.52%, its trading volume has increased by 19.08% in the past day.
Featured image from Adobe Stock, chart from Tradingview.com
- SEO Powered Content & PR Distribution. Get Amplified Today.
- PlatoData.Network Vertical Generative Ai. Empower Yourself. Access Here.
- PlatoAiStream. Web3 Intelligence. Knowledge Amplified. Access Here.
- PlatoESG. Carbon, CleanTech, Energy, Environment, Solar, Waste Management. Access Here.
- PlatoHealth. Biotech and Clinical Trials Intelligence. Access Here.
- Source: https://www.newsbtc.com/analysis/dot/polkadot-dot-in-freefall-will-it-recover-or-hit-rock-bottom/

