- The Mexican Peso holds steady near familiar highs as markets head towards 2024.
- Mexico’s Jobless Rate figures are due Thursday.
- A light week on the economic calendar sees only medium-impact data on the docket.
The Mexican Peso (MXN) is seeing choppy markets amidst post-holiday volume constraints but sticking close to recent highs as markets continue to lean into rate cut expectations from the Federal Reserve (Fed).
It’s a thin showing on the economic calendar for the shortened week heading into the new year, with October’s Mexico Jobless Rate slated for Thursday.
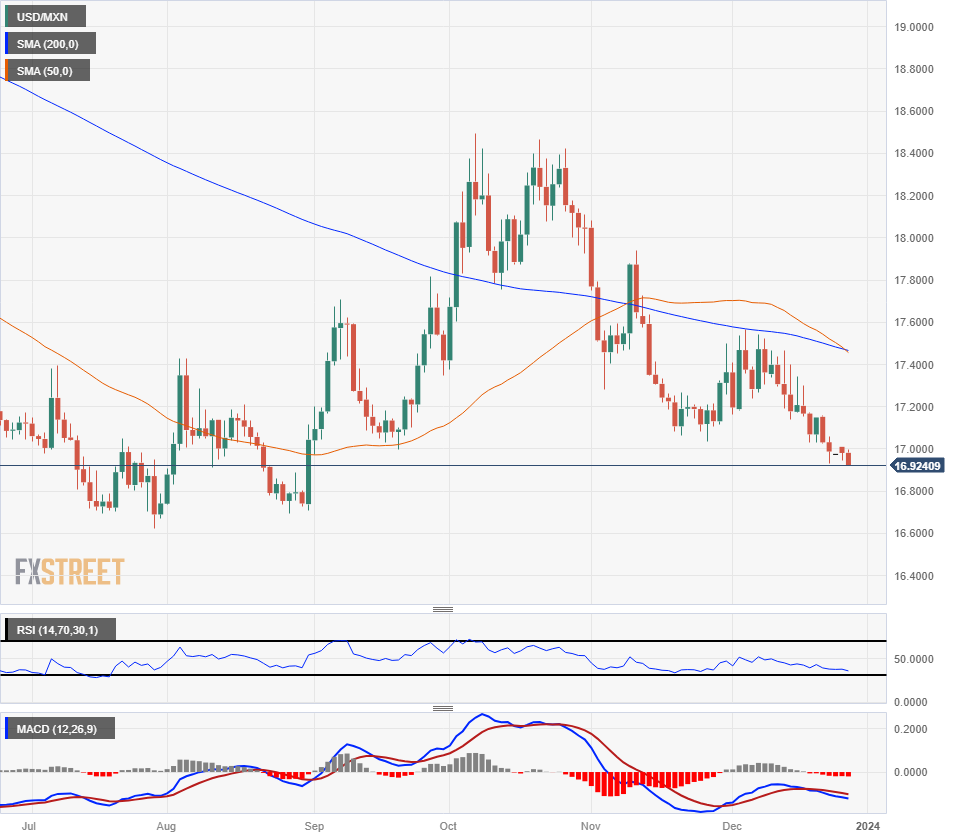
The Mexican Peso briefly tested a fresh 16-week high against the US Dollar (USD) before USD/MXN settled into a near-term trading range between 17.00 and 16.90.
Daily digest market movers: Mexican Peso testing highs amidst near-term chop as the year draws to a close
- The Mexican Peso has had a decent run, with the USD/MXN falling over three and a half percent from December’s peak of 17.56.
- December’s theme has been a Greenback selloff as markets gear up for Fed rate cuts in 2024.
- The US Dollar is deeply in the red for the month, falling across the major currency board and bolstering the Peso to multi-month highs.
- The US Richmond Fed Manufacturing Index dipped even lower in December, falling to -11 and accelerating past the market forecast of -7 following November’s -5 print.
- Softening economic data from the US increases the odds of further Fed rate cuts.
- Mexico’s November Jobless Rate due on Thursday, forecast to improve slightly from 2.7% to 2.6%.
- US Initial Jobless Claims for the week into December 22 and November’s US Pending Home Sales also on the docket for Thursday.
- US Initial Jobless Claims expected to tick higher once more from 205K to 210K.
- US Pending Home Sales from November is forecast to rebound to 1% growth after October’s 1.5% contraction.
US Dollar price this month
The table below shows the percentage change of US Dollar (USD) against listed major currencies this month. US Dollar was the strongest against the Pound Sterling.
| USD | EUR | GBP | CAD | AUD | JPY | NZD | CHF | |
| USD | -2.09% | -1.35% | -2.77% | -3.71% | -4.35% | -3.11% | -4.01% | |
| EUR | 2.04% | 0.71% | -0.68% | -1.60% | -2.23% | -1.00% | -1.88% | |
| GBP | 1.33% | -0.72% | -1.42% | -2.33% | -2.96% | -1.74% | -2.62% | |
| CAD | 2.70% | 0.69% | 1.39% | -0.91% | -1.54% | -0.33% | -1.18% | |
| AUD | 3.57% | 1.57% | 2.29% | 0.91% | -0.60% | 0.57% | -0.28% | |
| JPY | 4.16% | 2.20% | 2.87% | 1.51% | 0.63% | 1.20% | 0.34% | |
| NZD | 3.01% | 1.00% | 1.71% | 0.32% | -0.58% | -1.21% | -0.87% | |
| CHF | 3.82% | 1.82% | 2.53% | 1.17% | 0.26% | -0.36% | 0.83% |
The heat map shows percentage changes of major currencies against each other. The base currency is picked from the left column, while the quote currency is picked from the top row. For example, if you pick the Euro from the left column and move along the horizontal line to the Japanese Yen, the percentage change displayed in the box will represent EUR (base)/JPY (quote).
Technical Analysis: Mexican Peso leans into recent highs on thin market volumes
The Mexican Peso (MXN) is seeing some gains in choppy post-holiday markets, rising 0.4% on Wednesday to a new 16-week high. Momentum is unlikely to materialize with market depth on the thin side heading into the new year, but overall market sentiment is keeping pressure on the US Dollar, keeping the Greenback on the low side.
The USD/MXN continues to be sold off after getting rejected from the 200-day Simple Moving Average (SMA) near 17.60, and the 50-day SMA is set to confirm a bearish cross of the long-term moving average as price action continues to tilt towards the downside.
The last trading week of 2023 is set to close out with the US Dollar on the back foot once more, and the USD/MXN pair is likewise heading for another down month as the Greenback waffles against the Peso.
The USD/MXN has so far closed in the red for all but three months of the year.
USD/MXN Daily Chart
USD/MXN Weekly Chart

Interest rates FAQs
Interest rates are charged by financial institutions on loans to borrowers and are paid as interest to savers and depositors. They are influenced by base lending rates, which are set by central banks in response to changes in the economy. Central banks normally have a mandate to ensure price stability, which in most cases means targeting a core inflation rate of around 2%.
If inflation falls below target the central bank may cut base lending rates, with a view to stimulating lending and boosting the economy. If inflation rises substantially above 2% it normally results in the central bank raising base lending rates in an attempt to lower inflation.
Higher interest rates generally help strengthen a country’s currency as they make it a more attractive place for global investors to park their money.
Higher interest rates overall weigh on the price of Gold because they increase the opportunity cost of holding Gold instead of investing in an interest-bearing asset or placing cash in the bank.
If interest rates are high that usually pushes up the price of the US Dollar (USD), and since Gold is priced in Dollars, this has the effect of lowering the price of Gold.
The Fed funds rate is the overnight rate at which US banks lend to each other. It is the oft-quoted headline rate set by the Federal Reserve at its FOMC meetings. It is set as a range, for example 4.75%-5.00%, though the upper limit (in that case 5.00%) is the quoted figure.
Market expectations for future Fed funds rate are tracked by the CME FedWatch tool, which shapes how many financial markets behave in anticipation of future Federal Reserve monetary policy decisions.
- SEO Powered Content & PR Distribution. Get Amplified Today.
- PlatoData.Network Vertical Generative Ai. Empower Yourself. Access Here.
- PlatoAiStream. Web3 Intelligence. Knowledge Amplified. Access Here.
- PlatoESG. Carbon, CleanTech, Energy, Environment, Solar, Waste Management. Access Here.
- PlatoHealth. Biotech and Clinical Trials Intelligence. Access Here.
- Source: https://www.fxstreet.com/news/mexican-peso-clings-to-highs-as-markets-warm-up-post-holidays-202312271642

