Commencing the Sustainability journey
The reporting standards for Sustainability discussed in the previous blogpost provide a template for understanding and reducing the environmental, social and governance (ESG) effects that each business can cause. Although your business may not be initially required to report through one of the standards, your company’s customers may need to report and therefore will require your reports as part of the supply contract.
In the previous blogpost, the term Sustainable Supply Chains was used in the report by MIT. It stated that to commence the sustainability journey, the Supply Chain group (Procurement, Operations Planning and Logistics) needs to understand the potential ESG risks in the supply chains of their business. To achieve this requires mapping the organisation’s Supply Chains Network, supported by a Supplier Audit and a Code of Conduct developed for both the company and Tier 1 suppliers.
For some years, Learn About Logistics has discussed the need for Supply Chains Mapping, the value to your business and the implementation steps. This has been in the context of gaining a better understanding of the suppliers at the Tiers in the supply chains and how their risks may affect your company’s supply chains. This knowledge enables the Supply Chains group to enact a more pro-active response to unforeseen events in global supply.
Supply Chains Mapping
The objective of mapping your organisations supply chains is to develop a ‘big picture’ of the total supply chains network for the business. This is the Supply Chains Network Design Map. It is a two stage process. Stage one is to map the supply chains that you know – the Core supply chains, working back from your Tier 1 customers through your organisation to Tier 1 suppliers, as this enables the identification of ‘odd’ occurrences.
Stage 1 of mapping uses the four Flows – items, money, transaction data and information, applied to each supply chain. The diagram provides an representative outline of the physical flows of items through the Core supply chains operating as a ‘non-linear and complex’ system.
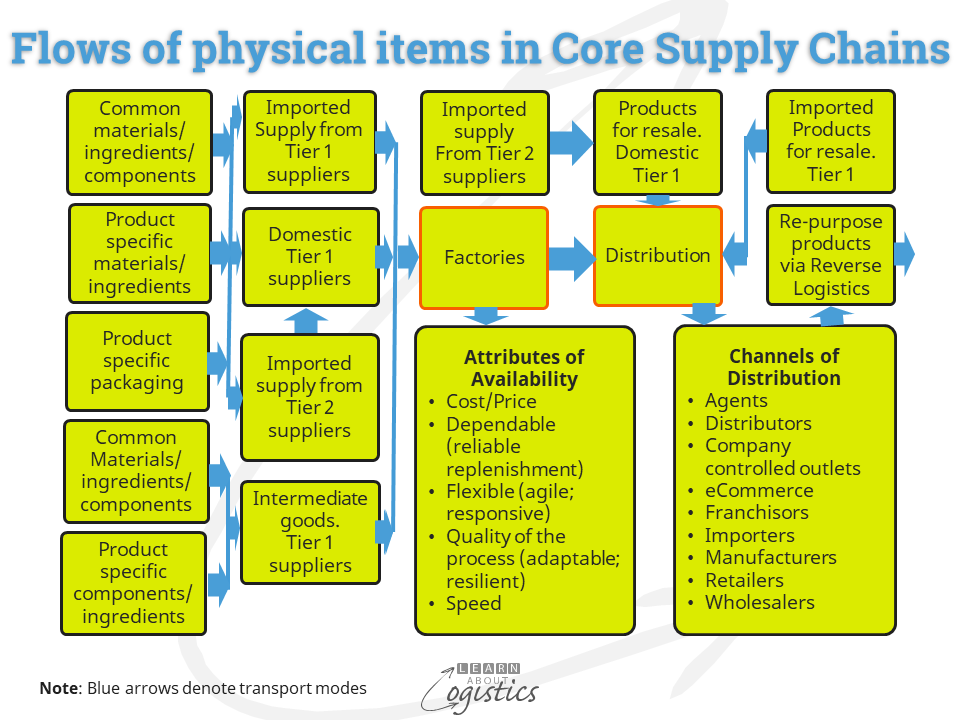
Flows reflect the patterns of data and the Variability of cycles – lead times (including in-transit shipments), rate of materials conversion, production yields etc. The physical Flows involve the contracted movement and storage of items by 3PL distribution businesses and different transport modes. The physical Flows may include:
- Inbound items (materials, intermediate goods and packaging) from Tier 1 suppliers
- Finished products for resale from Tier 1 suppliers
- Internal movements of intermediate goods from company owned facilities (a factory supplies another factory within the business)
- Contracted factories ship finished goods to distribution facilities
- Outbound deliveries to customers from distribution facilities (could also be direct from factories)
- Customer-service related Flows, such as service parts and
- Reverse logistics Flows (product returns to re-purpose items, recycle containers, etc.)
Because output governs what a business can sell, Product Platforms are used for groups of products, based on the capacity and capabilities of constraint resources within operations. Capacity is expressed as a standard unit of measure linked to the constraint resource e.g. tonnes, shippers, litres, hours, pallets, loads etc. Flows may contain multiple time periods, or ‘buckets’, so that seasonality and inventory pre-build can be identified. Also model the most favoured location for owned and contracted manufacturing, sea and airports for import and export, inventory consolidation locations and transport configurations.
Transfers between physical Nodes via transport Links in a Network
Nodes are each location in the Network that holds material items, money, data or information. On the map:
- Identify the company, suppliers’ and customers’ manufacturing and warehouse/distribution centre locations (including outsourced)
- Explain the capability (including capacity and responsiveness) and costs (even if estimated) at Tier 1 suppliers and customers
- Identify transport Nodes through the Core supply chains, such as sea and airports, transport hubs and intermodal terminals, with load capacity constraints and container/pack size limitations
- Variables: identify factors that can change the physical or financial values of items and money at a Node e.g. the Ph of chemicals that can alter the volume of material
- Time to Recover (TTR) if critical Nodes become unavailable
- The ESG challenges that apply at each Node. Examples are: weather related events, community challenges at a location and possible corrupt activities. Identify actions to address the challenges.
Links are the transport movements by mode between Nodes for materials and items. Identify customer demand patterns through each outbound Supply Chain. Also lead times; cross-border customs requirements; potential bottlenecks and wait times at country borders and organisations (especially LSPs) that own, control or influence critical Links. And the expected Time to Recover (TTR) if critical transport Links become unavailable.
Mapping is a structured mechanism for identifying areas for improvement across both the internal systems and external contract relationships. Modelling the Flows through your organisation together with comprehensive support documentation (such as the Sales Markets Segmentation Map, which identifies service requirements from the Supply Chains group) provides a comprehensive picture of your Core supply chains. Only when stage 1 of the project is completed should the ‘Extended’ supply chains (Tier 2 suppliers and customers and beyond) be documented. This is using the Supply Market Intelligence (SMI) approach.
- SEO Powered Content & PR Distribution. Get Amplified Today.
- Platoblockchain. Web3 Metaverse Intelligence. Knowledge Amplified. Access Here.
- Minting the Future w Adryenn Ashley. Access Here.
- Source: https://www.learnaboutlogistics.com/mapping-the-flows-through-core-supply-chains/#utm_source=rss&utm_medium=rss&utm_campaign=mapping-the-flows-through-core-supply-chains

