
US 30 looking for the high ground

The Dow Jones 30 looks to recoup its recent losses with a climb above 39000. The index is in a wait-and-see mode, with traders reluctant to take excessive risks before releasing the upcoming CPI data. On the chart, a close above 39400 and a bullish MA cross are signs that the market’s optimism has taken hold. A brief consolidation has allowed bulls to hold on to their gains. 38500 would be the bulls’ second line of defence in case of a correction.
EURUSD bounces back

The euro increased after the dollar had eclipsed price action with progressive NFP numbers. After bouncing off the daily swing low of 1.0720, the single currency is striving to resume its uptrend starting in February. The latest pullback has found strength over the 20 day SMA at 1.0820, and a break above the immediate resistance at 1.0900 suggests buyers are still committed. A close above 1.0970 would expose this year’s peak, potentially giving bulls a decisive edge. 1.0760 on the 30-day SMA is a significant floor.

NZDUSD hitting double top
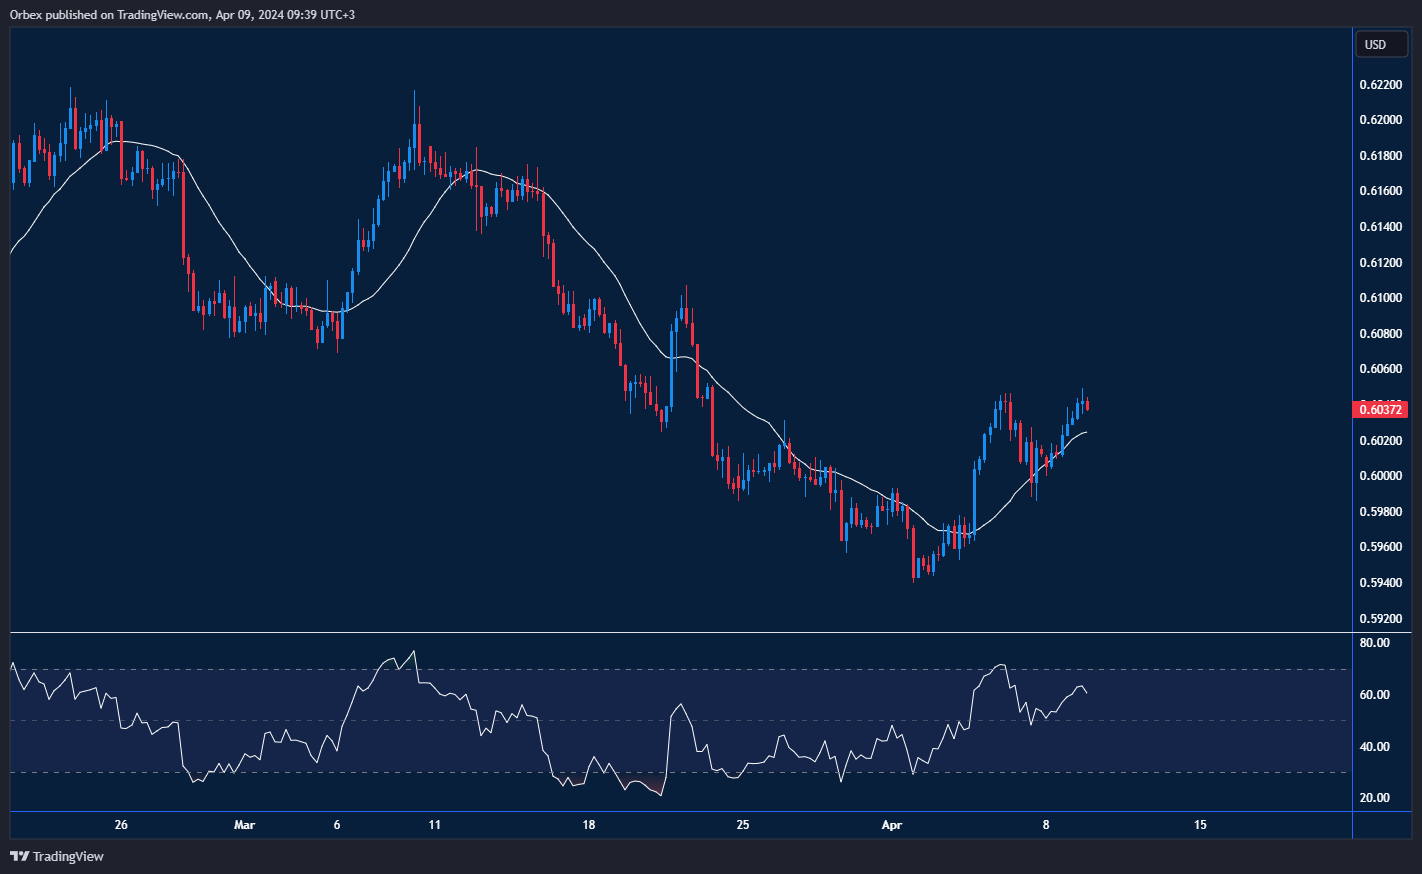
The US dollar maintains dominance over the Kiwi despite the pair recovering almost 100 pips to the upside. 0.6050 has once again proved a challenging level to crack after the first two bullish attempts. A drop below the recent support at 0.5985 could prompt more buyers to bail out. 0.6020 is the first hurdle, and a break below 0.6000 would turn sentiment around. Failing that, moving higher above 0.6100 is critical to keep the pair afloat, as its breach would make the Kiwi look for a full retracement to last week’s highs.
Test your forex trading strategy with Orbex
- SEO Powered Content & PR Distribution. Get Amplified Today.
- PlatoData.Network Vertical Generative Ai. Empower Yourself. Access Here.
- PlatoAiStream. Web3 Intelligence. Knowledge Amplified. Access Here.
- PlatoESG. Carbon, CleanTech, Energy, Environment, Solar, Waste Management. Access Here.
- PlatoHealth. Biotech and Clinical Trials Intelligence. Access Here.
- Source: https://www.orbex.com/blog/en/2024/04/intraday-analysis-usd-awaits-cpi-data

