
USDCAD attempts to rebound

The Canadian dollar slipped after the BoC signalled a pause in rate increases. On the daily chart, the pair is looking to hold above 1.3320 as a triangle consolidation pattern seems to be taking shape between 1.3230 and 1.3700.

After hitting resistance at the former support at 1.3520 the short-term price action reversed and tested 1.3320 again. Its breach would send the greenback to the critical floor at 1.3230. On the upside, 1.3500 is the first hurdle and 1.3660 may cap any further advance in the short-term.
EURAUD sinks further
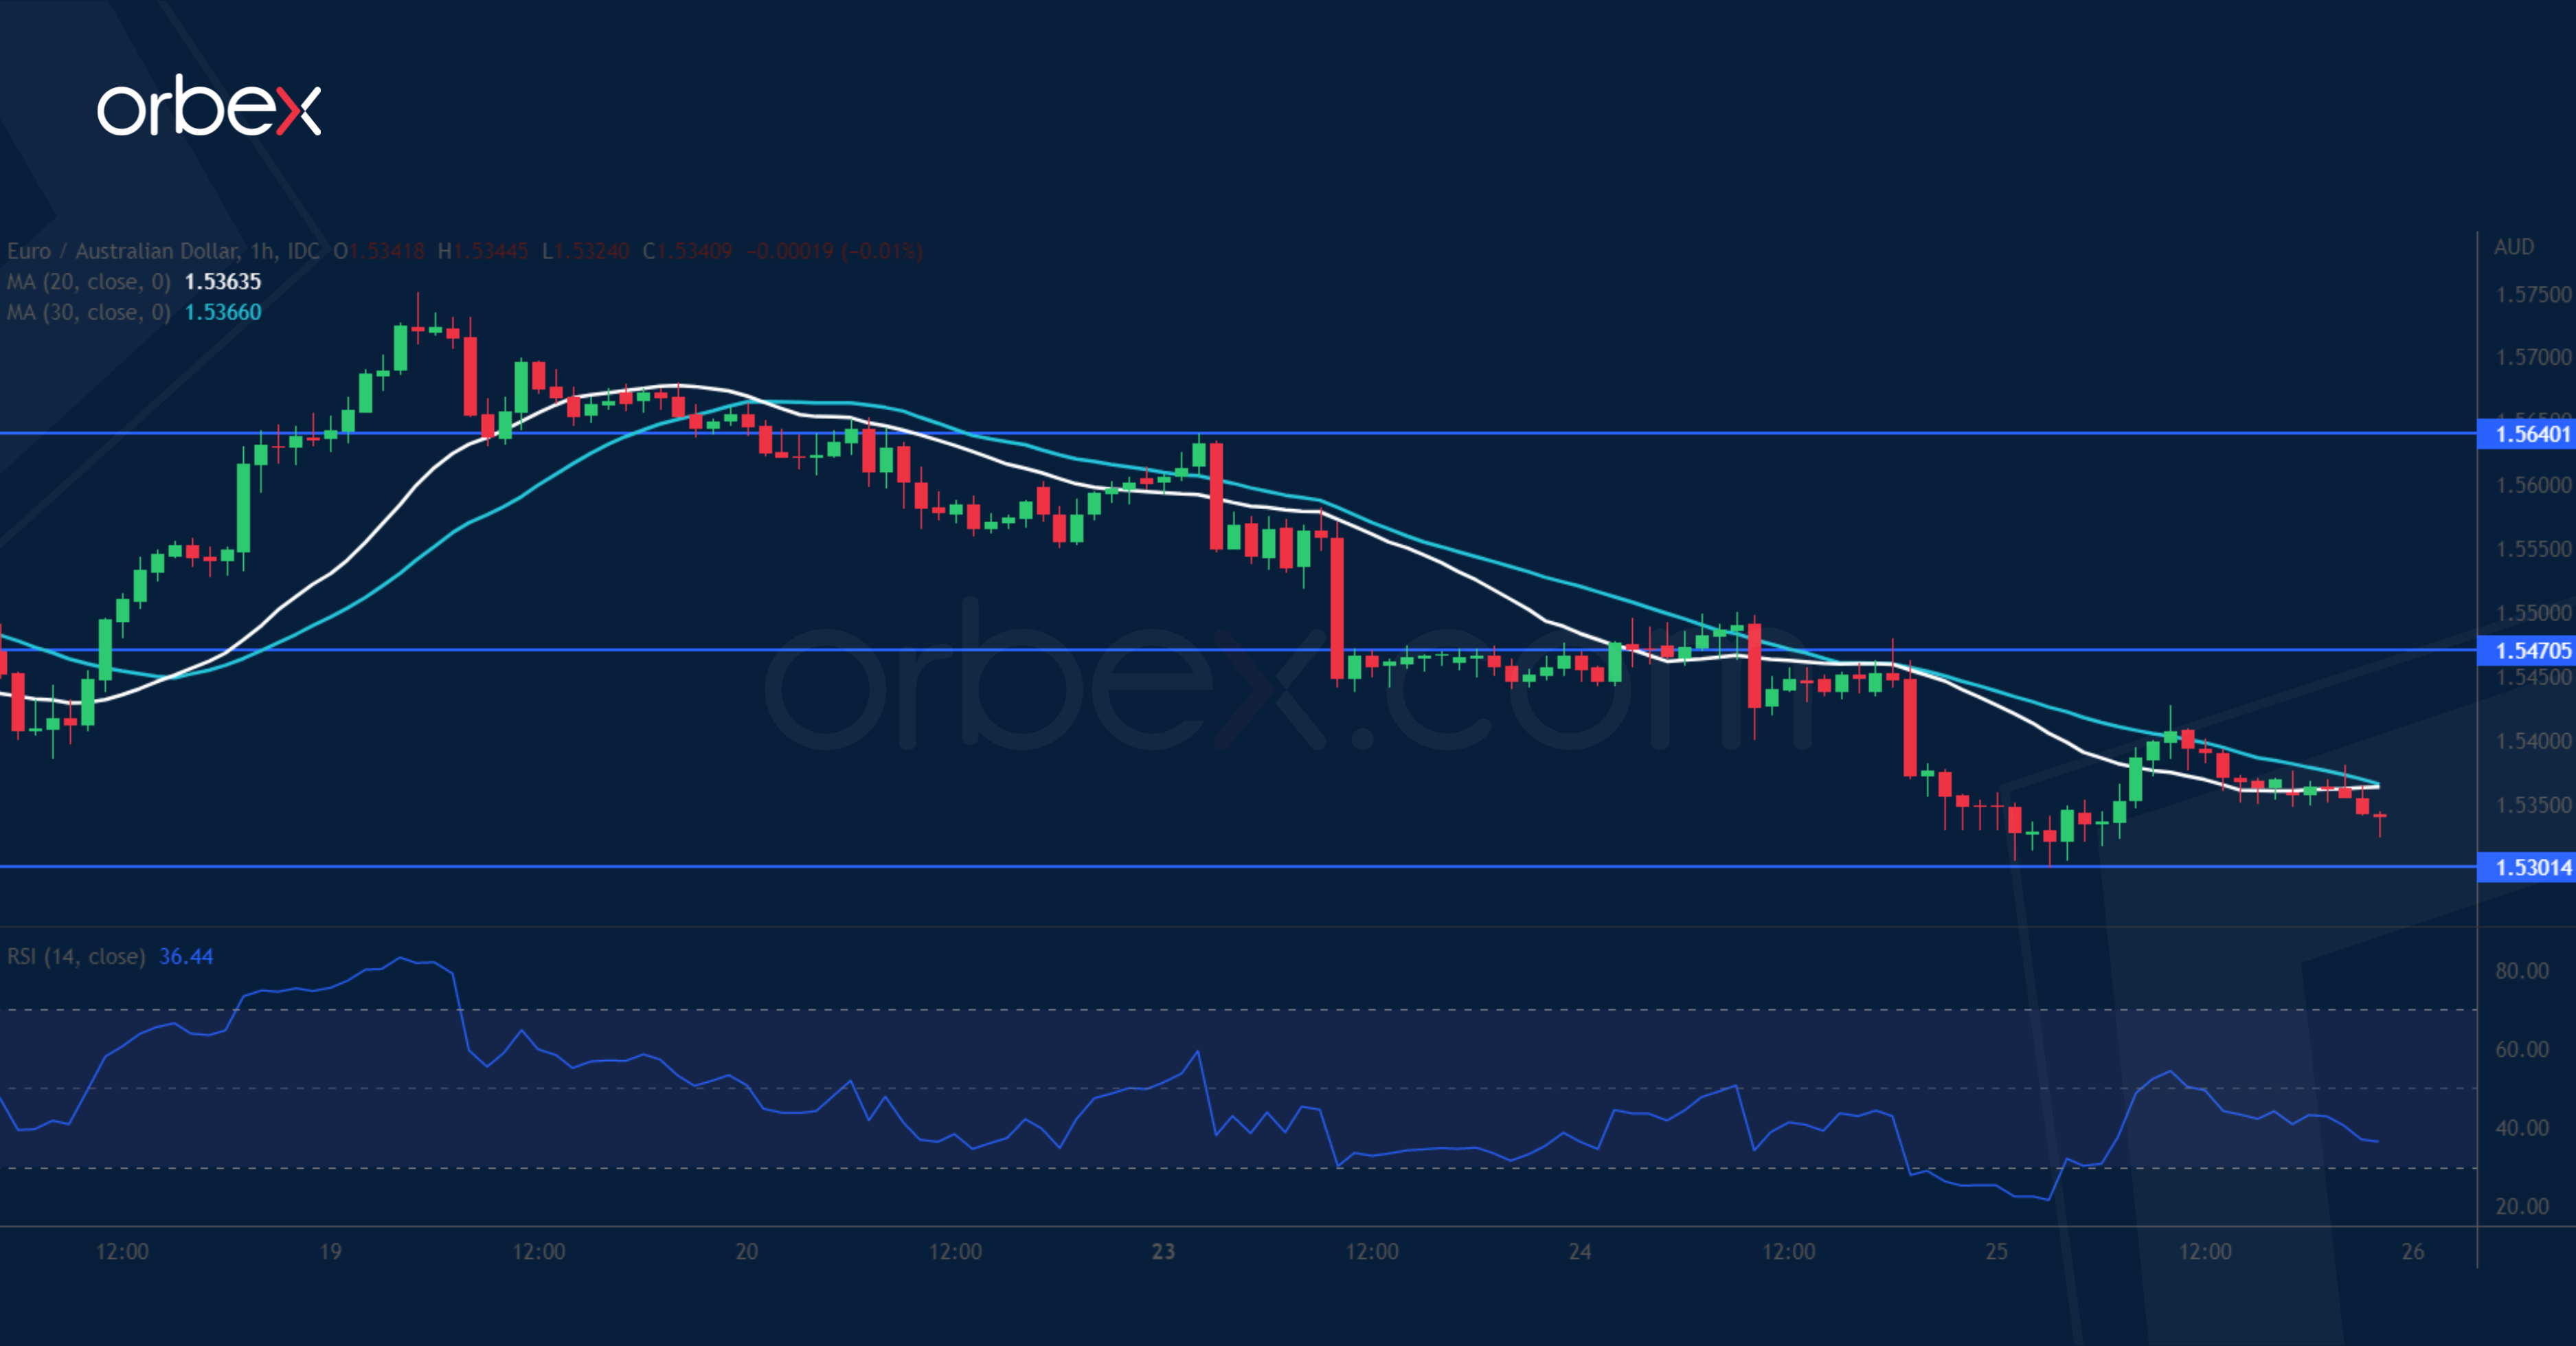
The Australian dollar climbed after Q4 inflation came in hotter-than-expected. On the daily chart, the euro turned south at the support-turned-resistance (1.5950) from a sell-off earlier last year. This suggests that the medium-term bias is still skewed to the downside. Zooming into the hourly chart, a break below 1.5400 has invalidated the latest bounce and confirmed the pessimism on the higher timeframe. The RSI’s oversold situation has gathered limited support over 1.5300, but stiff selling could be expected around 1.5470.
USOIL consolidates gains

WTI crude treads water as US crude inventories show a smaller buildup. The price action is grinding last December’s high of 82.50 as its breach might trigger an extended rally in the medium-term. Instead, a drop below the immediate support at 80.30 has put the bulls on the defensive. The previous swing low at 78.10 sits on the 20-day moving average and is a key level to keep the price afloat. A bearish breakout would shake out recent buyers and send the price to the psychological level of 75.00.
Test your strategy on how the CAD will fare with Orbex
- SEO Powered Content & PR Distribution. Get Amplified Today.
- Platoblockchain. Web3 Metaverse Intelligence. Knowledge Amplified. Access Here.
- Source: https://www.orbex.com/blog/en/2023/01/intraday-analysis-cad-falls-back

