In the rapidly changing landscape of blockchain technology, the second-largest cryptocurrency Ethereum remains a leader in innovation. The platform’s support for decentralized applications (dApps) and smart contracts continues to fuel a wide range of developments in sectors like decentralized finance (DeFi), gaming, and non-fungible tokens (NFTs). with its upcoming Cancun upgrade and optimism around the spot ETH, its future projection seems promising for this altcoin.
Is Ethereum Ready for Uptrend?
Source-Tradingview
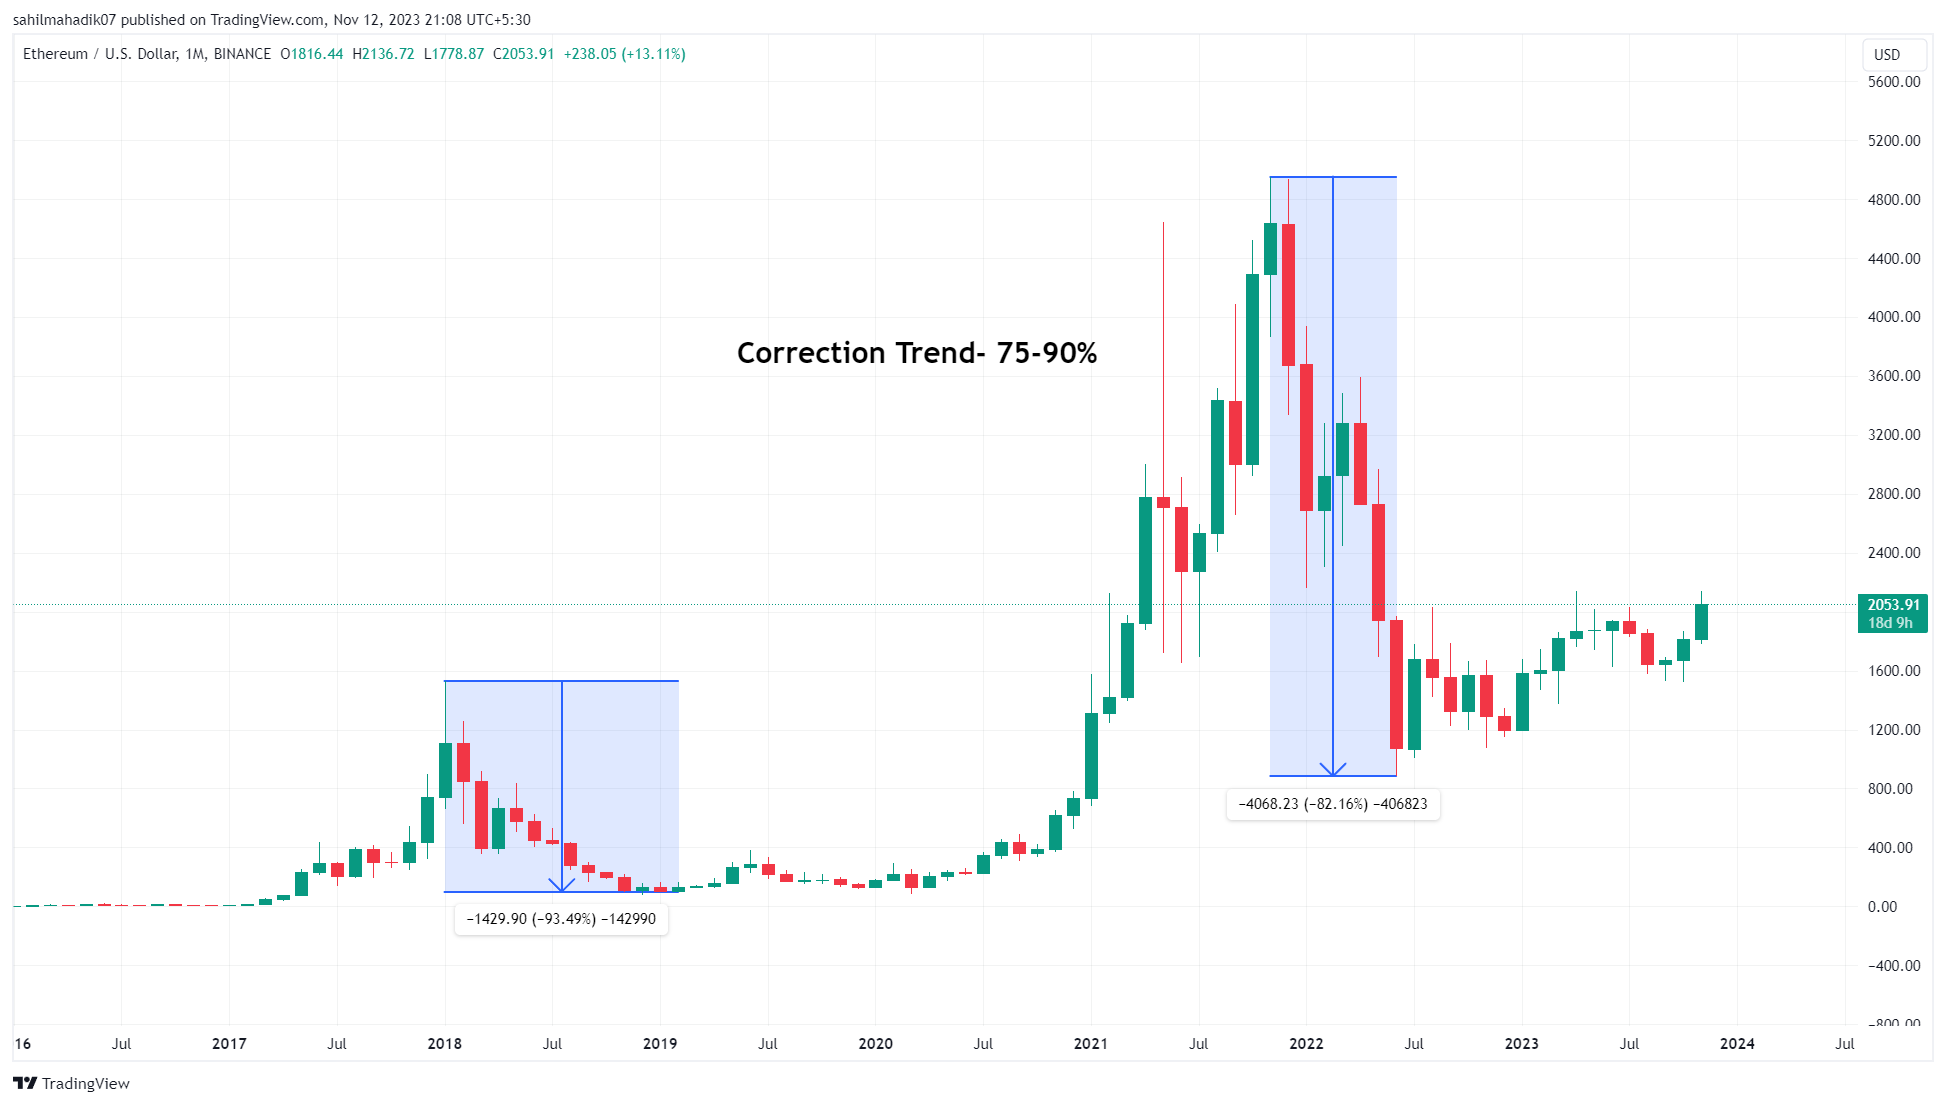
A look at the higher time frame is crucial to understanding the major trend in the asset and where it is currently positioned. Analyzing the data since 2013, the Ethereum coin has undergone three to four significant corrections, each obliterating about 70-80% of its market value, only to rebound with a substantial surge thereafter. This recurring pattern can offer significant insight into whether ETH price is ready for a major uptrend.
- June-Dec 2016 Peak to Trough: The Ethereum price soared to a high of $21.5 and plunged to $6.2, registering 71.4%
- 2018 High to Low: From the January high of $1529, the correction phase evaporated 94.8% to reach a December low of $79.06
- November 2021 to November 2022: from a peak of $4951 to a downfall of $883.6, the coin price witnessed an 82.16% loss.
If this repetitive pattern stands firm, the Ethereum price has witnessed a suitable downtrend of 82% which would likely trigger a bullish trend ahead.
- Daily transactions on the ETH network

The Ethereum price recovery from mid-October has been paralleled by a notable surge in daily transactions on its network. This uptick in transaction volume is a critical indicator of the network’s health, revealing insights into its active usage and the level of user interaction.
The data is telling: from a low of 921,231 daily transactions on October 15th, the Ethereum network activity escalated to an impressive 1.108 million transactions by November 11th. This significant jump highlights an increasing level of user engagement and growing adoption of Ethereum.
- Ethereum- Global In/Out of the Money (GIOM)

The Global In/Out of the Money (GIOM) metric for Ethereum presents an optimistic picture: As of now, 62.13% of ETH addresses are ‘in the money,’ meaning they are currently profiting, while 34.19% are ‘out of the money,’ indicating they are at a loss. This suggests a stable investor base, less prone to panic selling, which could foster a sustained bullish trend.
The distribution of profitable versus non-profitable addresses is a key indicator of market sentiment and investor behavior.
- New Address Created
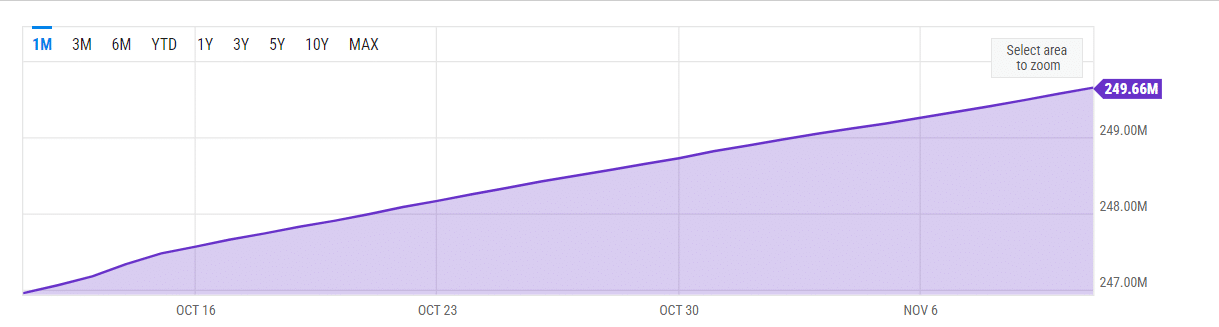
This metric monitors the daily creation of new Ethereum addresses as a significant indicator of network activity and potential growth. The increase in new addresses, from 247.47M on October 15 to 249.66M on November 11, points to a rising level of participation in the ETH network. This surge in new addresses often precedes an uptick in demand for Ether, which can positively influence its price
Ethereum Cancun Upgrade
The Ethereum Cancun upgrade encompasses major enhancements for both layers of Ethereum: the Cancun upgrade for the execution layer (Layer 1, L1) and the Deneb upgrade for the consensus layer (Layer 2, L2). Scheduled for Q1 of 2024, this dual-layer upgrade aims to substantially improve the Ethereum network in several key areas.
The Cancun-Deneb upgrade is expected to elevate the scalability, security, and overall efficiency of the Ethereum network. One of the central features of this upgrade is the introduction of proto-danksharding, a process designed to optimize operations and reduce the high gas fees associated with Ethereum transactions. This enhancement is expected to address some of the long-standing challenges faced by the Ethereum network, potentially making it more accessible and user-friendly, and laying the groundwork for broader adoption and more diverse applications of Ethereum in the blockchain ecosystem
Recommended Articles
Buzz for Ethereum Spot ETF
The largest asset management company, BlackRock filing for a spot Ethereum ETF, named the “iShares Ethereum Trust,” has created a significant stir in the crypto sphere. This move, confirmed on November 9, propelled the ETH value beyond the $2,000 psychological mark, marking a substantial 12.3% increase. This development caused a ripple effect in the altcoin market as it bolstered the continuation of the November rally.
Additionally, the crypto community is already buzzing with expectations for a regulatory green light on a spot Bitcoin ETF, a development that further solidifies the cryptocurrency industry’s standing in the financial world.
ETH/USD Daily Chart: Can Recovery Surpass $3000?
Source-Tradingview
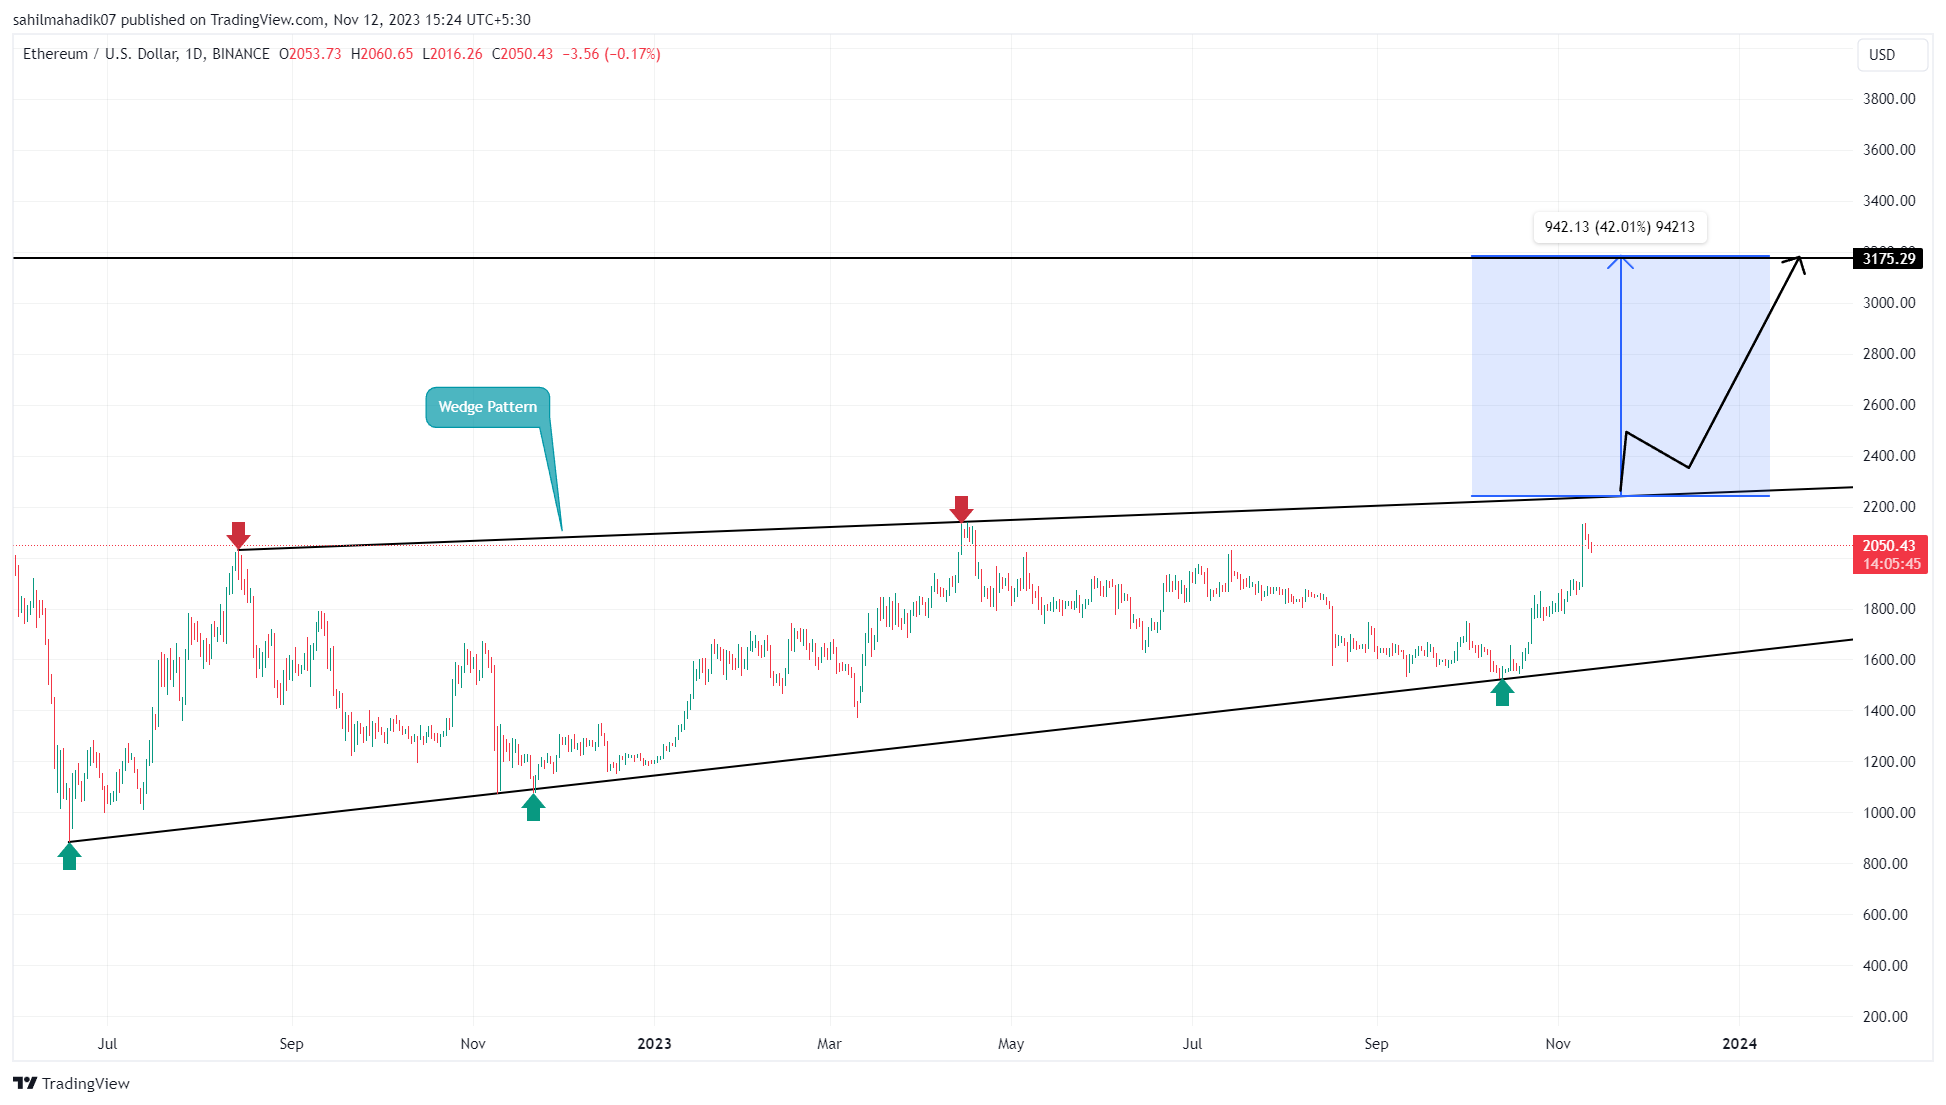
The daily time frame chart shows that the Ethereum price has been riding a slow yet steady recovery under the influence of a rising wedge pattern. The two rising trendlines of this pattern offer dynamic resistance and support and the prices rebounded twice from the upper boundary and thrice from the lower indicating its strong influence.
The ETH price has been under strong recovery since mid-October when the prices jumped from $1527 to the current trading price of $2055, accounting for a bullish recovery of 34.8%. With sustained buying, the coin price could surge another 8-10% to hit the upper trendline around $2240.
Consider a bullish scenario, an upside breakout from the aforementioned resistance would intensify the buying momentum and may push the prices 40% higher to reach the $3175 target.
ETH/USD Weekly Chart: Pullback or Recovery?
Source- Tradingview
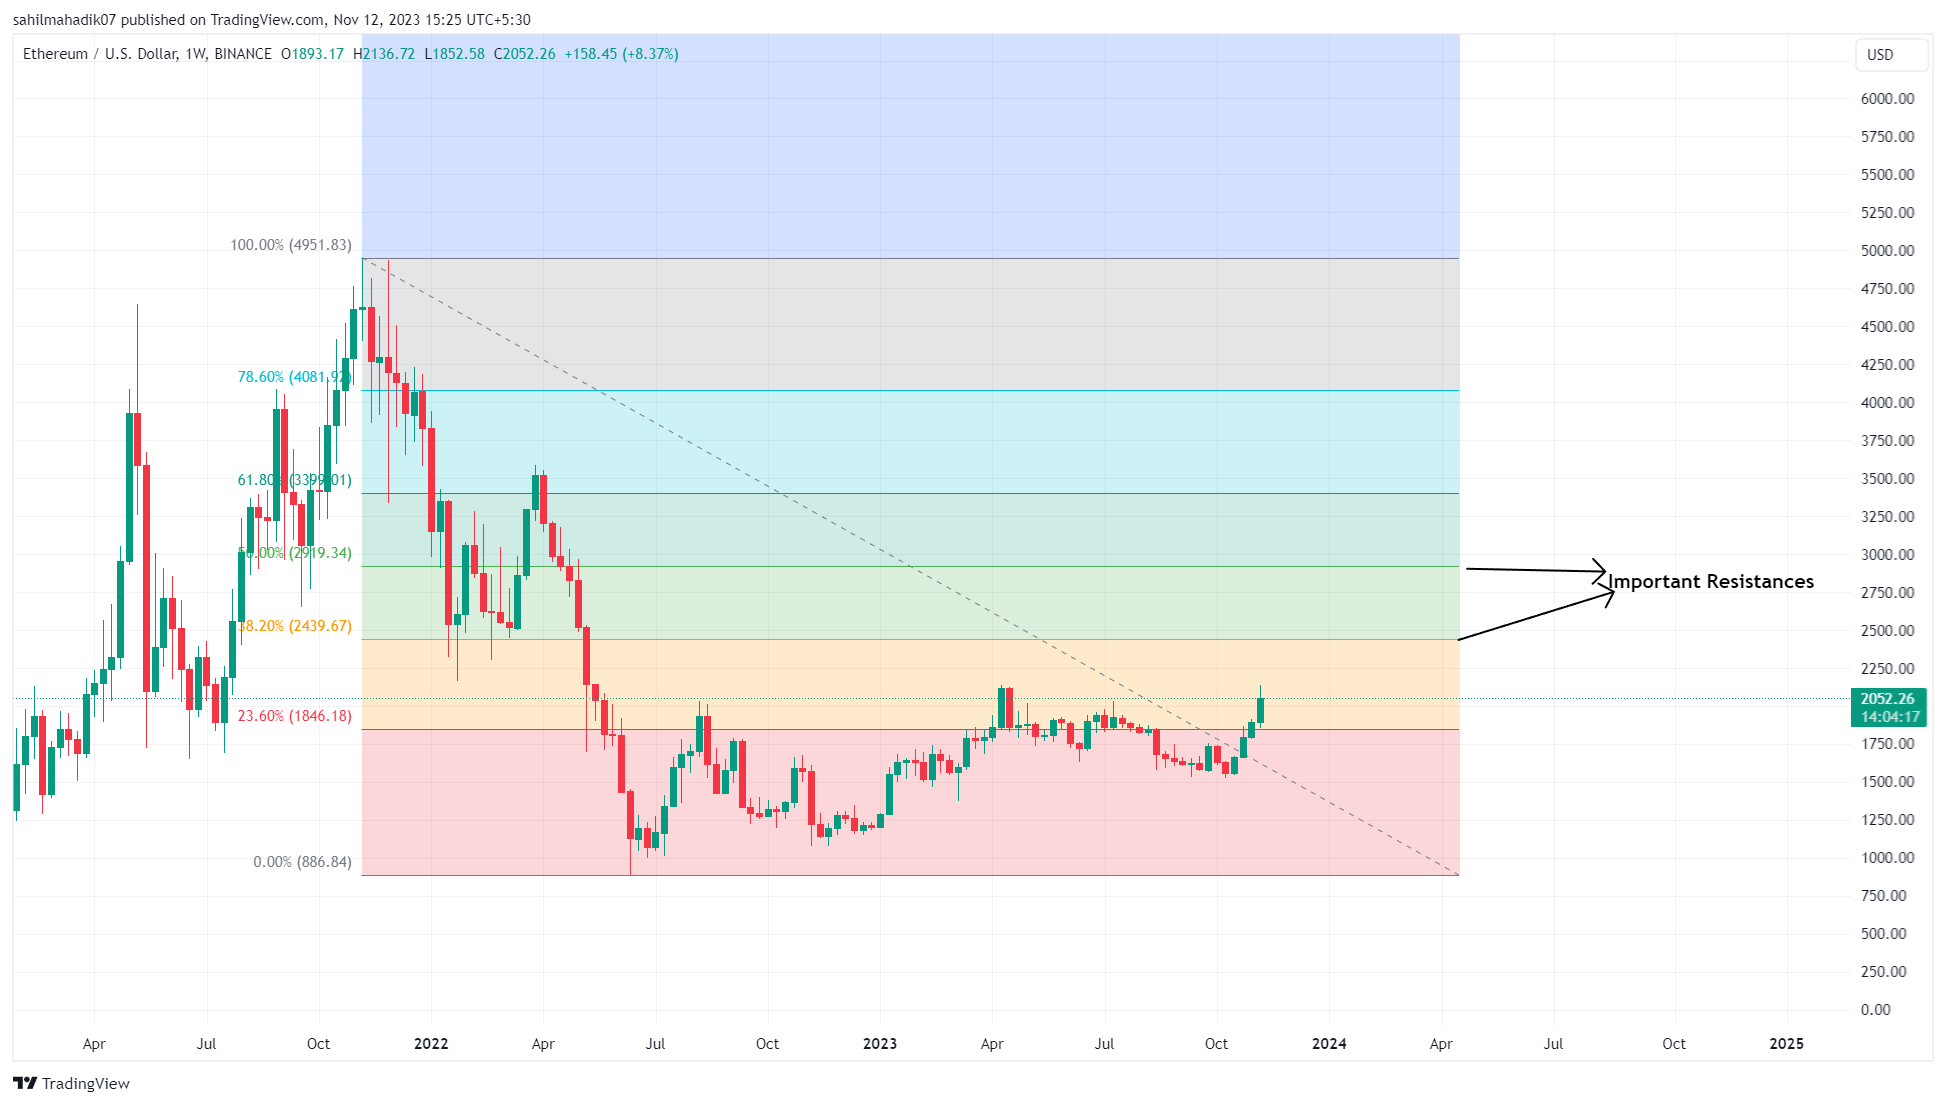
From June 22’ low of $883.6, the Ethereum price recovery has gained 133% to reach the $2055 mark. The bullish rally, which has crossed the 23.6% Fibonacci retracement level, marked a notable shift in its trajectory.
This move draws attention to key resistance levels: the 38.2% FIB at $2440 and the $2,900 mark at the 50% FIB level. Until the ETH price overcomes the 50% FIB threshold, the risk of a continuing downtrend persists.
Yet, a breakthrough above this level could signal a waning of bearish forces, pointing to an emerging bullish grip on the market.
- SEO Powered Content & PR Distribution. Get Amplified Today.
- PlatoData.Network Vertical Generative Ai. Empower Yourself. Access Here.
- PlatoAiStream. Web3 Intelligence. Knowledge Amplified. Access Here.
- PlatoESG. Carbon, CleanTech, Energy, Environment, Solar, Waste Management. Access Here.
- PlatoHealth. Biotech and Clinical Trials Intelligence. Access Here.
- Source: https://coingape.com/blog/has-the-ethereum-price-bull-market-train-left-the-station/

