Talking points
- FOMC Meeting Minutes Post CPI Numbers
- EURUSD – Weekly and 1-hour charts
- USDJPY – Weekly chart
FOMC Meeting Minutes Post CPI Numbers
Traders and Investors will be keeping a close eye today on the FOMC meeting minutes expected to be released at 2 PM EST, market participants are looking for any information that may help in forecasting the FED’s next move and how the FED officials view the rate hike path for next year. The FED decided to keep rates on hold at their November 1st, 2023, meeting at its current range of 525-550. The recent CPI figures suggested that inflation is slowing down, and this led traders to believe that the FED may be done hiking for now. According to the latest CME FedWatch tool probabilities figures, 99.8% of market participants expect rates to remain on hold for the December 13th, 2023, meeting. It goes much further than that as 28% of participants expect a 25-basis point rate cut for the March 20th, 2024, meeting.
The change in sentiment was due to lower CPI numbers which reflected the fact that inflation is slowing down, the market reaction to the slowing inflation was straightforward, and the US Dollar was down against other currencies as traders fully digested the fact of no FED hikes for now. Whether this market shift will continue or not is yet to be seen and may depend on how traders interpret the meeting minutes today, we also should bear in mind that the meeting minutes due today were for a meeting that took place before the latest CPI numbers and the change in sentiment.
It is also worth noting that the economic calendar for this week is light, and although we have important figures due for release, however, we have a bank Holiday in Japan and Thanksgiving Day in the USA. The FX markets remain open; however, the holiday may have an impact on market liquidity and finance charges. (Some instruments may not be available for trading depending on the jurisdiction)
EURUSD – Weekly chart
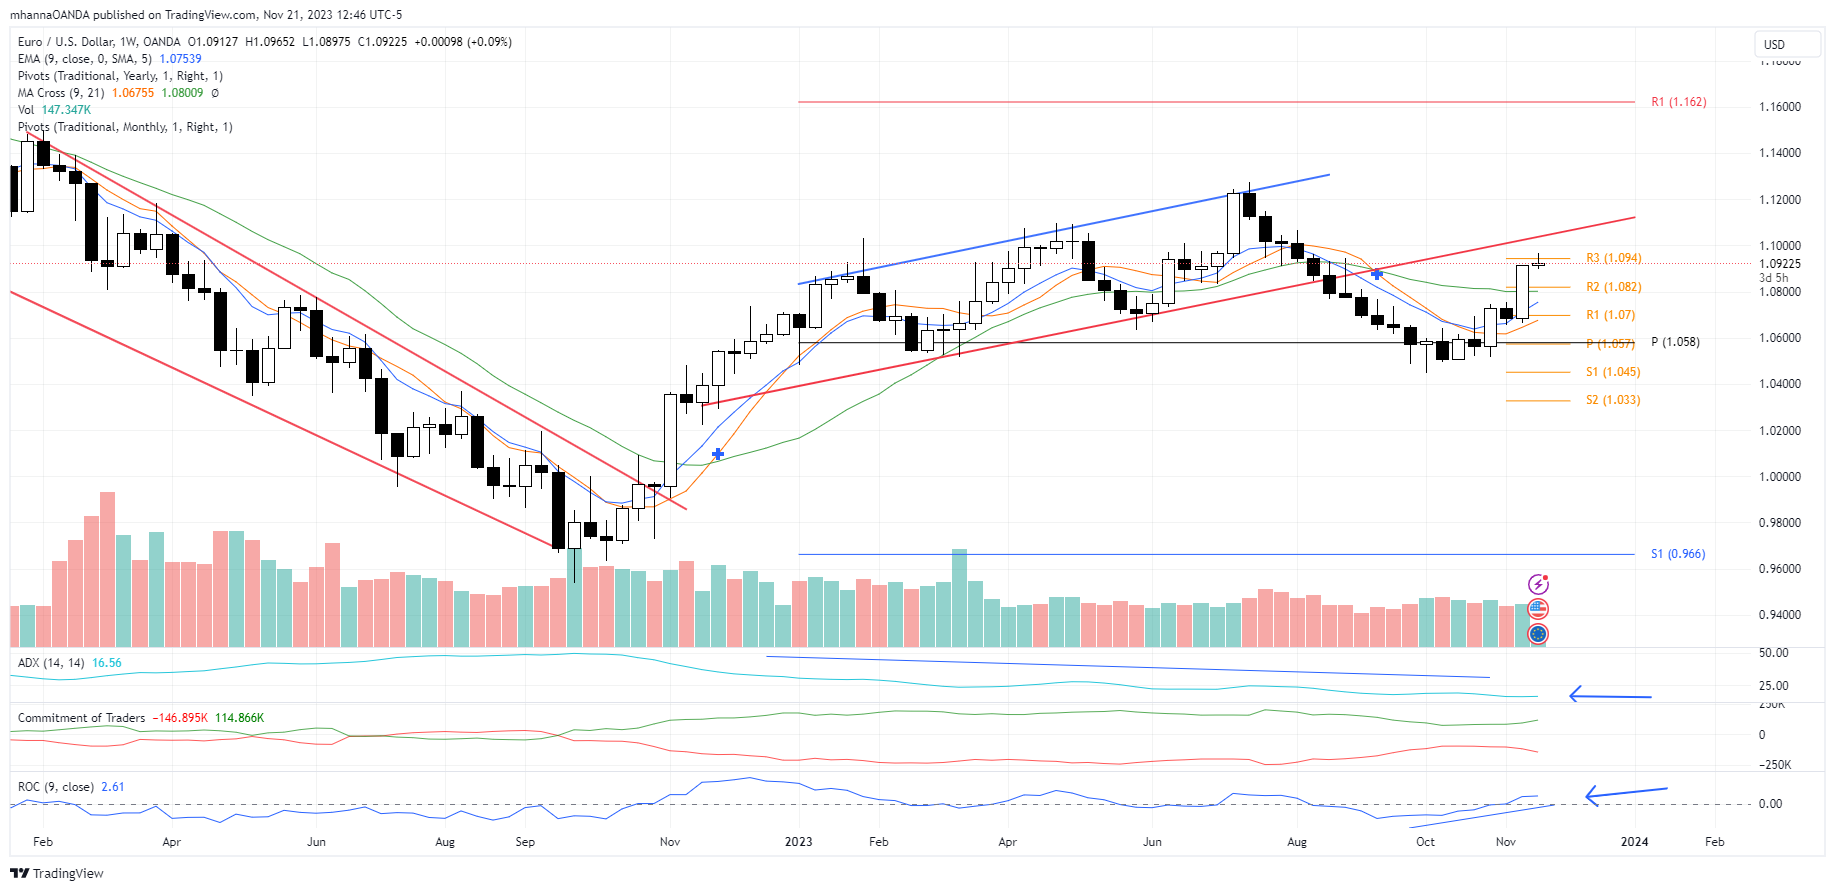
- Price action is still trading below the ascending channel identified on the weekly chart, the price pulled back, broke, and closed above the breakout level of 1.0858. Price is currently attempting to reach the resistance level represented by extending the breakout line above the 1.1040 area.
- Price is currently trading well above its annual PP of 1.0580 and below its monthly resistance R3 of 1.0940.
- Although near its averages, the rising tick volume is supporting the latest upside price action, however, higher volume needs to be maintained to support further upside price action.
- ADX indicator is at its extreme lows and possibly signaling the beginning of a new move regardless of direction.
- ROC is following the new uptrend and supporting the price action so far.
- The COT report is in line with price action, large speculators are following the new uptrend and commercials are doing what they usually do which is selling to hedge their exposure.
EURUSD – 1-Hour chart
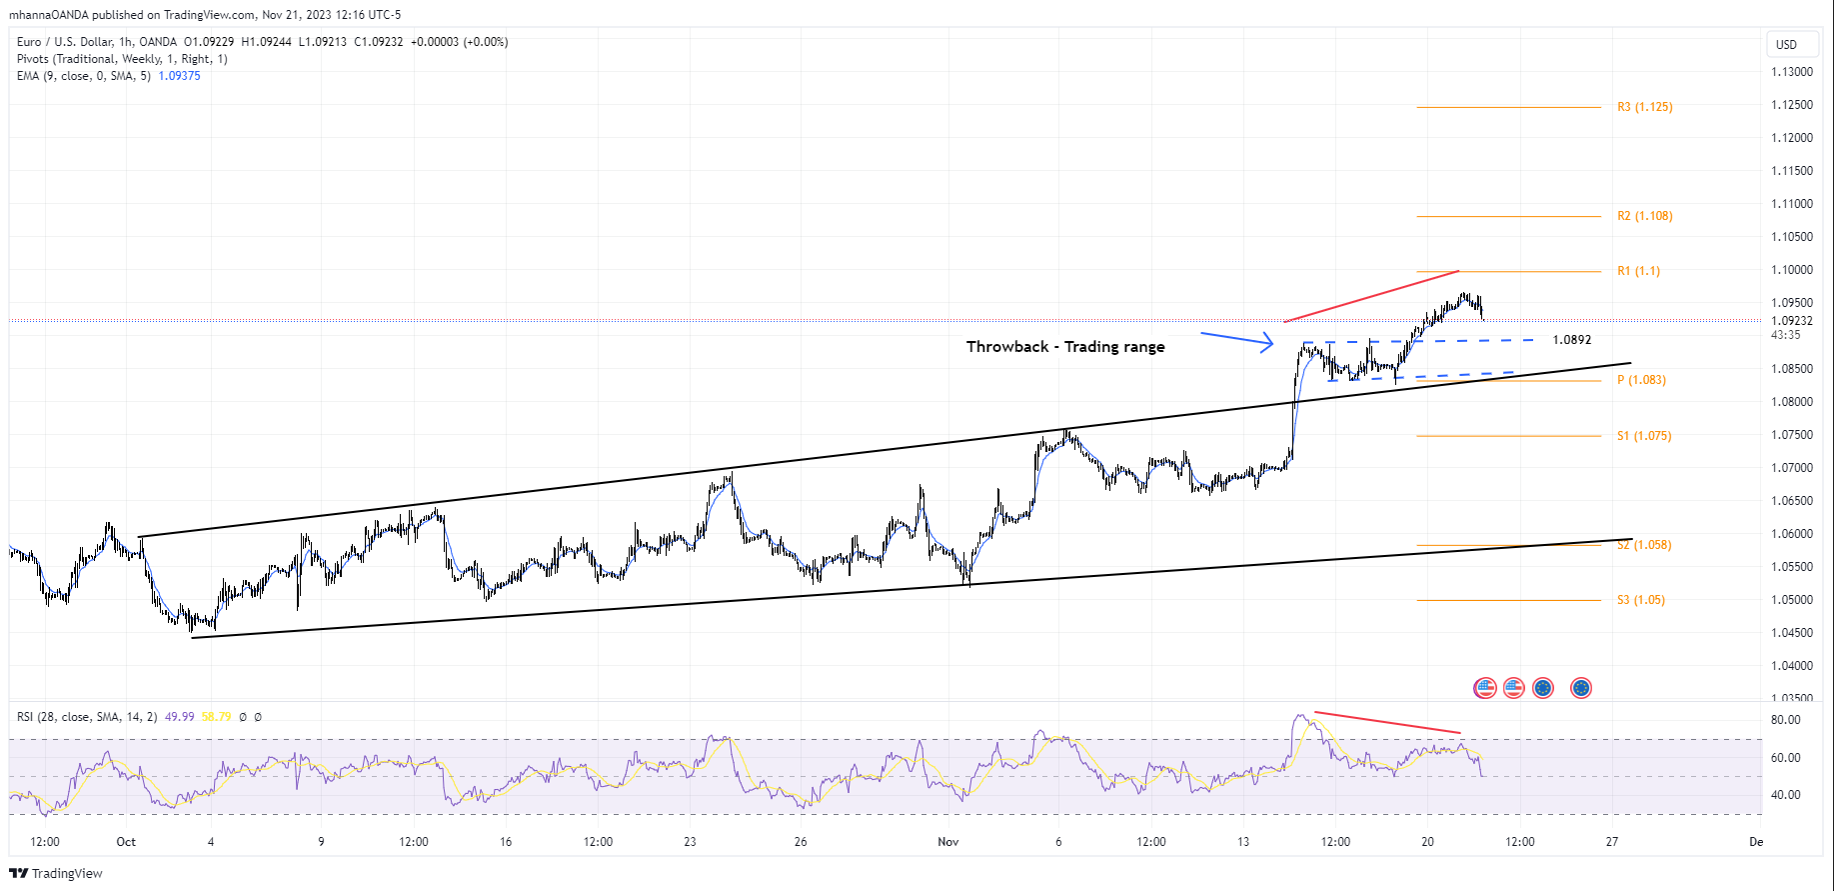
- Price was trading within an ascending channel (Black lines), broke and closed above the upper borders, and a throwback already took place within the trading range (dashed blue lines) identified on the channel.
- The upper border of the dashed trading range may act as support if we have a throwback near 1.0890, the next confluence of support would be the lower trading range border intersection with the weekly pivot point near 1.0830.
- RSI is in line with price action; however, a negative divergence (Red lines) can be seen as the price makes higher highs and RSI makes lower highs. Although divergences are critical, however, it can be due to reduced trading volume before the FED news.
- Price broke below its fast EMA9 and we will continue to monitor price action around the moving average.
USDJPY – Weekly chart
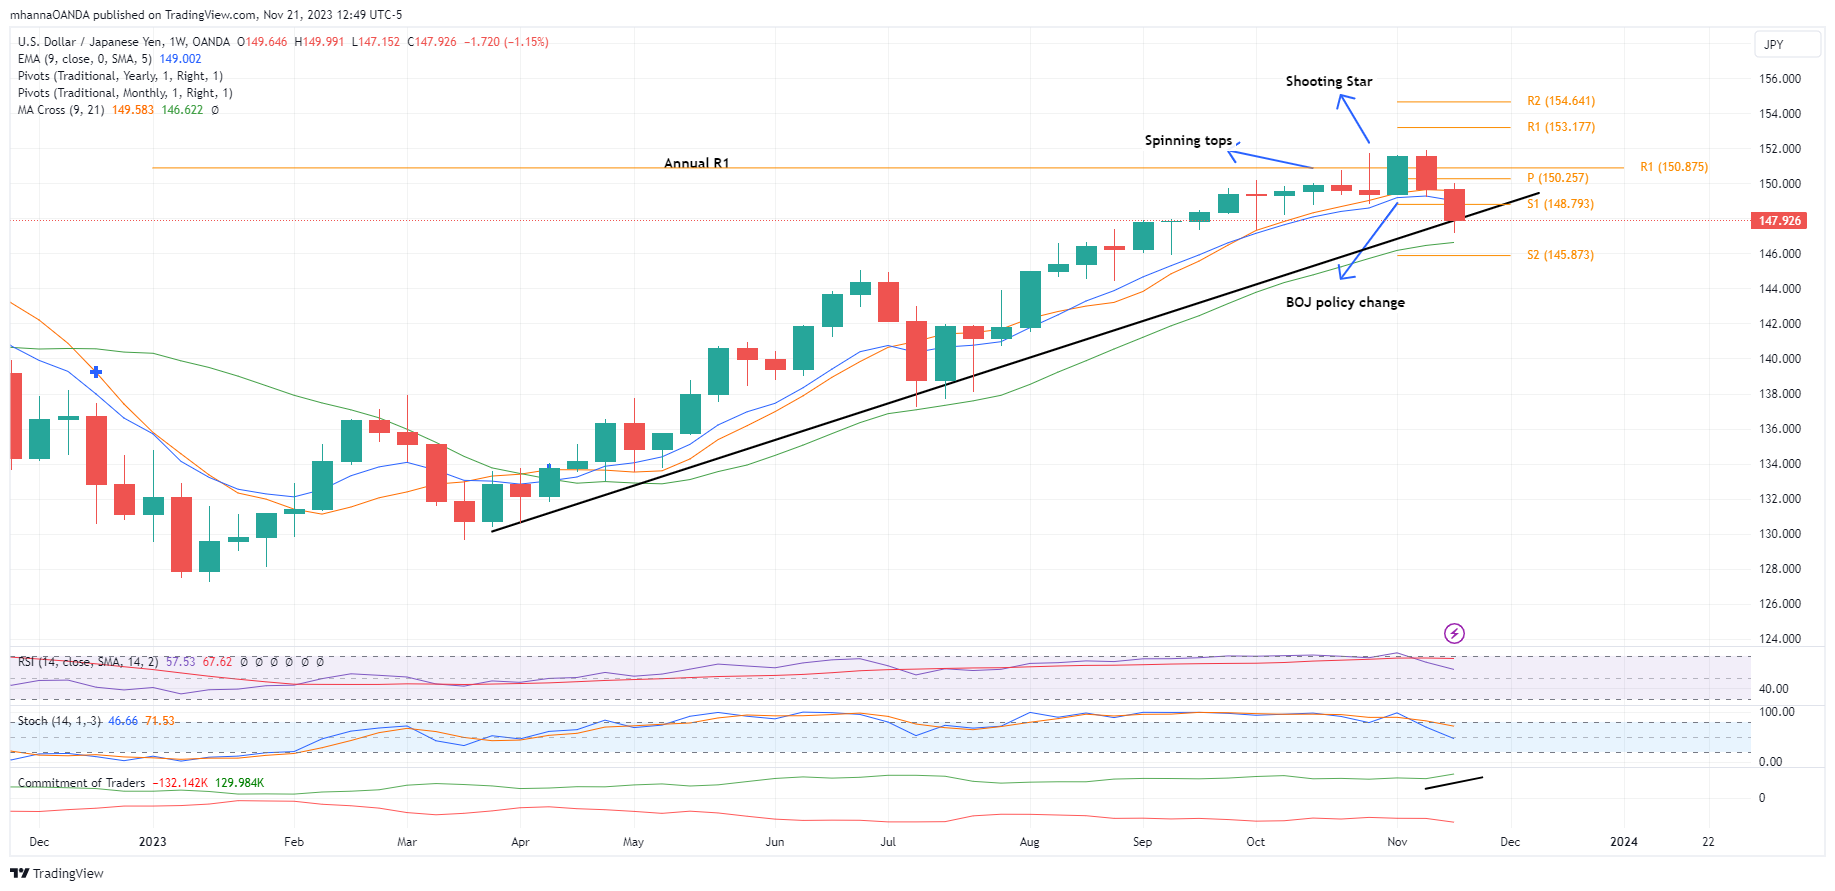
- Price is trading in an uptrend and currently finding support after its recent decline at its intersection with the trendline.
- Candlestick patterns reflected multiple spinning tops, a shooting Star, and currently attempting to form a Bearish Engulfing pattern which would consist of two weekly candles.
- The candle representing price action that took place with the BOJ policy change is highlighted on the chart for reference.
- Both RSI and Stochastic indicators are in line with the latest price action and already heading towards bearishness if the price were to decline further.
- We highlighted the COT report on the weekly chart, as we may have a positive divergence between positioning and the latest price action, and we will continue to monitor its development.
Conclusion
The minutes may show the FED officials continue to walk the fine line in their attempt to curb inflation back to the 2% target level without derailing the economy, the minutes may also be interpreted differently by market participants depending on everyone’s trading plan or objective. FED meeting minutes can cause volatility which may result in noisy charts and erratic price action at news time, it is also possible to see initial market reactions fading, so trading responsibly and managing risk during news time especially news from the FED is critical to our trading.
Content is for general information purposes only. It is not investment advice or a solution to buy or sell securities. Opinions are the authors; not necessarily that of OANDA Business Information & Services, Inc. or any of its affiliates, subsidiaries, officers or directors. If you would like to reproduce or redistribute any of the content found on MarketPulse, an award winning forex, commodities and global indices analysis and news site service produced by OANDA Business Information & Services, Inc., please access the RSS feed or contact us at info@marketpulse.com. Visit https://www.marketpulse.com/ to find out more about the beat of the global markets. © 2023 OANDA Business Information & Services Inc.
Latest posts by Moheb Hanna (see all)
- SEO Powered Content & PR Distribution. Get Amplified Today.
- PlatoData.Network Vertical Generative Ai. Empower Yourself. Access Here.
- PlatoAiStream. Web3 Intelligence. Knowledge Amplified. Access Here.
- PlatoESG. Carbon, CleanTech, Energy, Environment, Solar, Waste Management. Access Here.
- PlatoHealth. Biotech and Clinical Trials Intelligence. Access Here.
- Source: https://www.marketpulse.com/forex/eur/fomc-meeting-minutes-a-technical-analysis-approach-for-eurusd-usdjpy/mhanna

