Join Our Telegram channel to stay up to date on breaking news coverage
The dYdX price prediction shows that DYDX is seen breaking above the $2.00 resistance level to head toward the channel.
dYdX Prediction Statistics Data:
- dYdX price now – $2.10
- dYdX market cap – $334.1 million
- dYdX circulating supply – 156.2 million
- dYdX total supply – 1 billion
- dYdX Coinmarketcap ranking – #93
DYDX/USD Market
Key Levels:
Resistance levels: $2.50, $2.60, $2.70
Support levels: $1.70, $1.60, $1.50
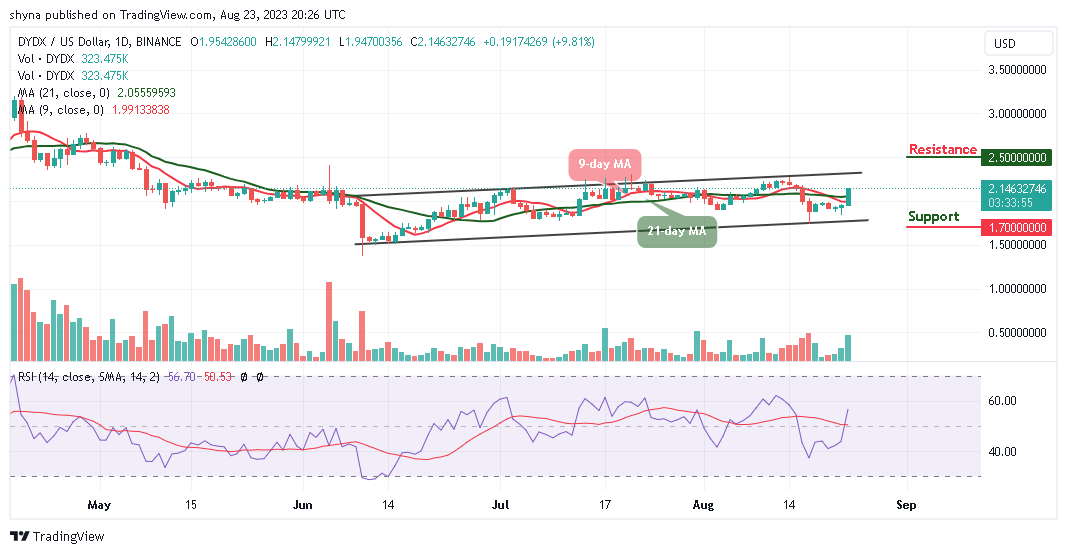
DYDX/USD is seen refreshing to a new daily high as the coin heads to the upside to trade close to the resistance level of $2.20. Meanwhile, the coin is currently trading at $2.14 with a bullish movement above the 9-day and 21-day moving averages. On the contrary, if the dYdX price slides below the lower boundary of the channel, sellers could return to the market, but the bulls are likely to collect more on the price dips.
dYdX Price Prediction: DYDX Heads to the North
The dYdX price may need to maintain the upward movement if the newly touched $2.14 resistance level is maintained at all costs. At the moment, the technical indicator Relative Strength index (14) is likely to cross above the 60-level as the signal line points to the north to encourage more buyers. However, dYdX (DYDX) can now begin to follow the uptrend as soon as the coin remains above the moving averages.
Nonetheless, if the red line of the 9-day MA crosses above the green line of the 21-day MA, the dYdX price could perform well and may reach the resistance levels at $2.50, $2.60, and $2.70 respectively. Meanwhile, if the market price slides and faces south, there may be a bearish drop which could roll the coin down to the support levels of $1.70, $1.60, and $1.50 respectively.
DYDX/BTC Creates Additional Gains
Against Bitcoin, the dYdX price is hovering above the 9-day and 21-day moving averages as the price touches the daily high at 8119 SAT. However, the technical indicator Relative Strength Index (14) is likely to move into the overbought region as the coin aims for more uptrends.
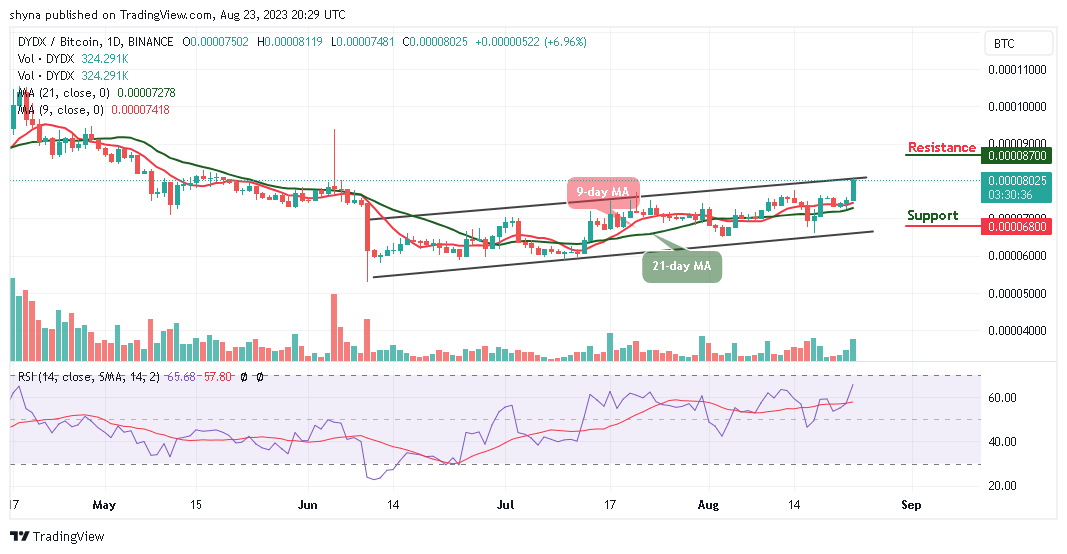
Moreover, the potential resistance level could be located at 8700 SAT and above, but a lower sustainable move may cancel the bullish movement and this could attract new sellers coming into the market with the next focus on the support level of 6800 SAT and below.
Alternatives to dYdX
At the time of writing, DYDX/USD is trading at $2.14 within the channel, indicating a bullish movement in the market. For now, the market price is moving toward the resistance level of $2.20 while the trading volume confirms the upward movement.
Meanwhile, the Wall Street Memes ($WSM) token presale has now raised over $25 million, with investors clamoring to get involved before it concludes. Leveraging clever marketing and a highly engaged online community, Wall Street Memes has defied expectations, setting the stage for a highly-anticipated exchange launch in the next few weeks.
Wall Street Memes – Next Big Crypto

- Early Access Presale Live Now
- Established Community of Stocks & Crypto Traders
- Featured on BeInCrypto, Bitcoinist, Yahoo Finance
- Rated Best Crypto to Buy Now In Meme Coin Sector
- Team Behind OpenSea NFT Collection – Wall St Bulls
- Tweets Replied to by Elon Musk
Join Our Telegram channel to stay up to date on breaking news coverage
- SEO Powered Content & PR Distribution. Get Amplified Today.
- PlatoData.Network Vertical Generative Ai. Empower Yourself. Access Here.
- PlatoAiStream. Web3 Intelligence. Knowledge Amplified. Access Here.
- PlatoESG. Automotive / EVs, Carbon, CleanTech, Energy, Environment, Solar, Waste Management. Access Here.
- PlatoHealth. Biotech and Clinical Trials Intelligence. Access Here.
- ChartPrime. Elevate your Trading Game with ChartPrime. Access Here.
- BlockOffsets. Modernizing Environmental Offset Ownership. Access Here.
- Source: https://insidebitcoins.com/news/dydx-price-prediction-for-today-august-23-dydx-technical-analysis

