Image by Author
Data visualization is a crucial skill for anyone working with data. But creating beautiful, informative data viz can be time-consuming and require specialized tools. That’s where ChatGPT comes in. With its latest updates, ChatGPT makes data visualization faster and easier than ever before.
The latest update has improved the ChatGPT experience significantly. Now, instead of having to switch between different options like the original GPT-4, GPT4 with advanced analysis, or DALLE-3, you simply need to type in a prompt, and ChatGPT will automatically interpret your request and generate the desired results.
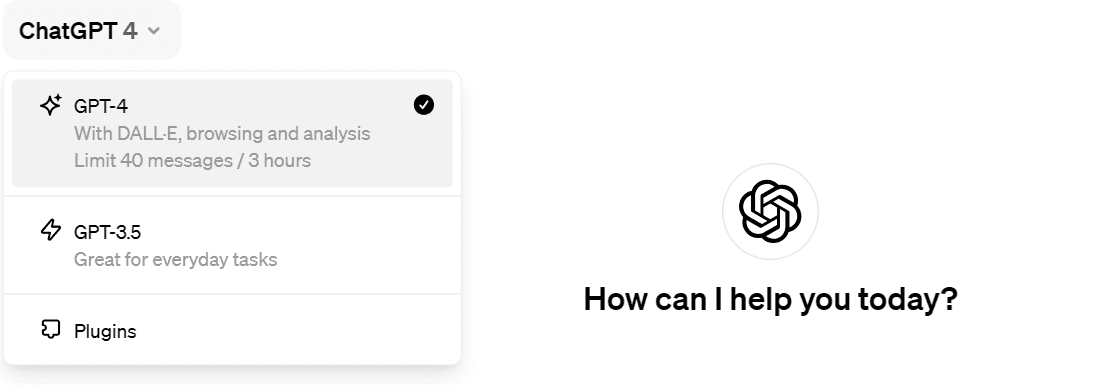
Image from ChatGPT
In this blog post, we’ll explore how to instantly generate various data visualizations using plain English prompts. Thanks to ChatGPT’s advanced data analysis, you don’t need to process the data or run the Python code. We’ll walk through simple pie and bar charts, then tackle more complex visualizations using real-world datasets.
In this part, we will write a simple prompt to generate plots. The prompt includes data in the form of a Python dictionary.
Pie Chart
Before we create a prompt, please ensure that you are using the GPT-4 model, as it is the only one that supports generating visualizations.
We will write a prompt to generate a pie chart visualization based on various nutrient data. Additionally, we have requested that ChatGPT use a lighter color combination, as the default colors are pretty bright.
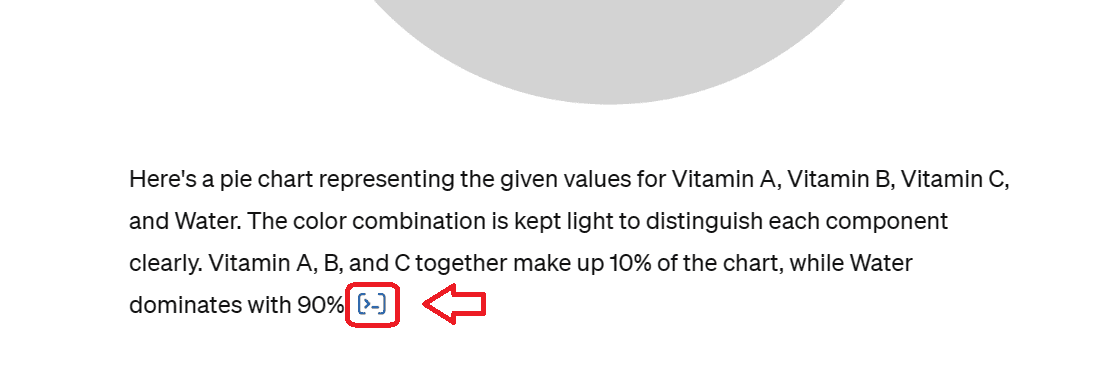
Prompt: Generate a pie chart of values {"Vitamin A":5, "Vitamin B": 1, "Vitamin C": 4, "Water": 90} to keep the color combination light.As you can see, we got great results.

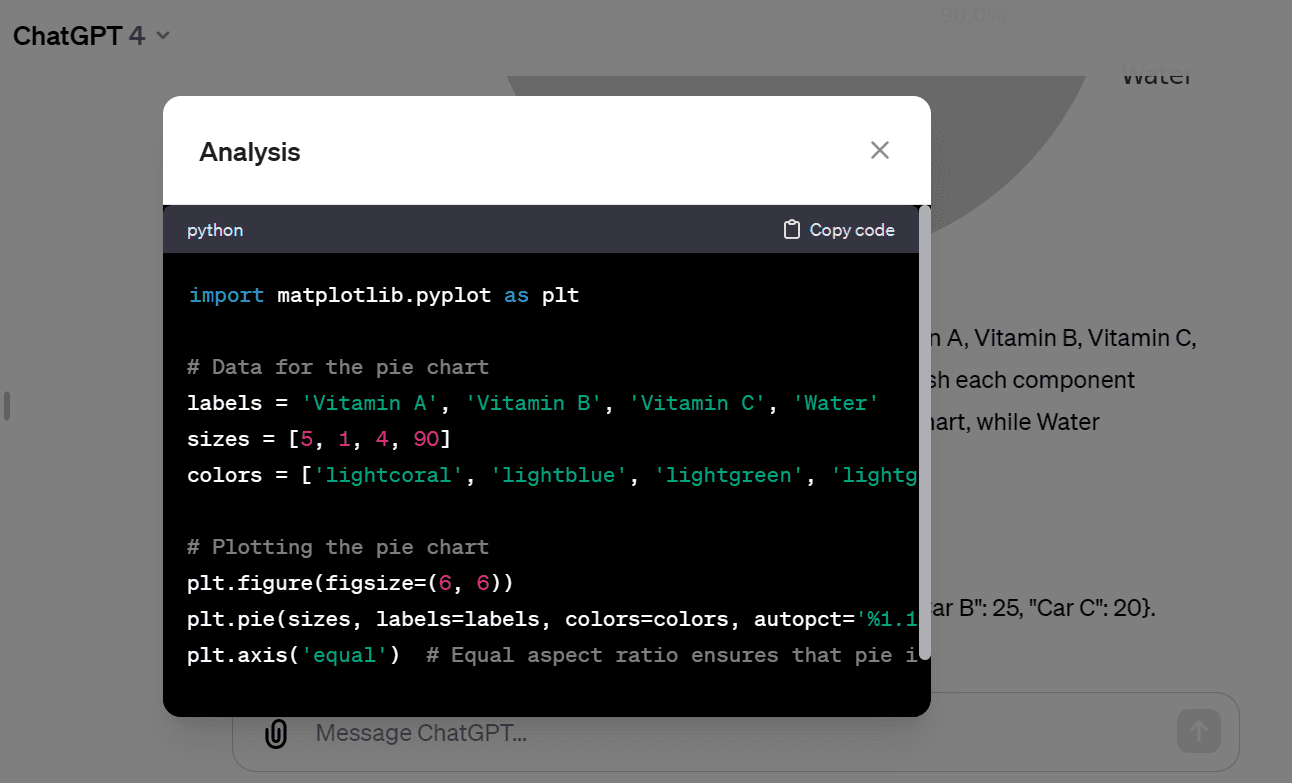
If you want to see the Python code behind the visualization, you have to click on the terminal logo at the end of the result.
After that, a window will appear containing the source code that you can modify and execute on your own. However, this step is not mandatory, as ChatGPT will simply run the code and display the visualizations as images. You can save these images for your presentation or report.
Bar Chat
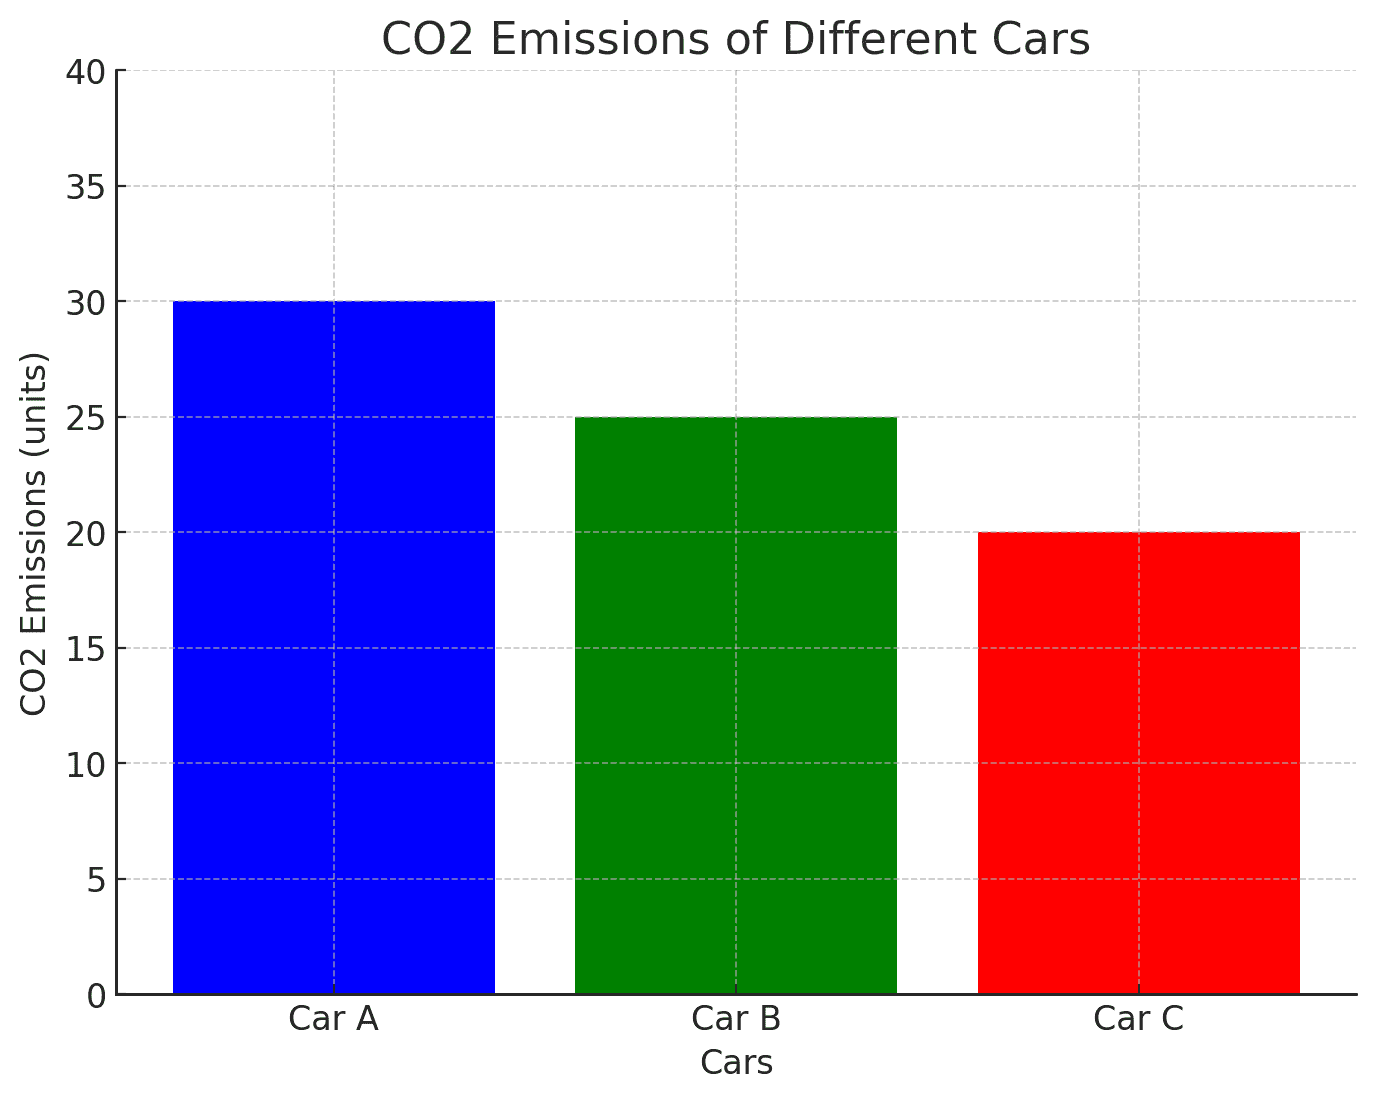
In the next part, we provide CO2 emission data for the car and let ChatGPT do the magic.
Prompt: Generate a bar plot co2 emissions of values {"Car A":30, "Car B": 25, "Car C": 20}.It has added the title, x and y labels, and ensured descending order. Perfect!!!
Instead of excessively controlling ChatGPT’s output, you can ask it to create results independently, similar to various Python AutoViz libraries. By simply providing the dataset and requesting a complete exploratory data analysis to generate the necessary plots for you to review.
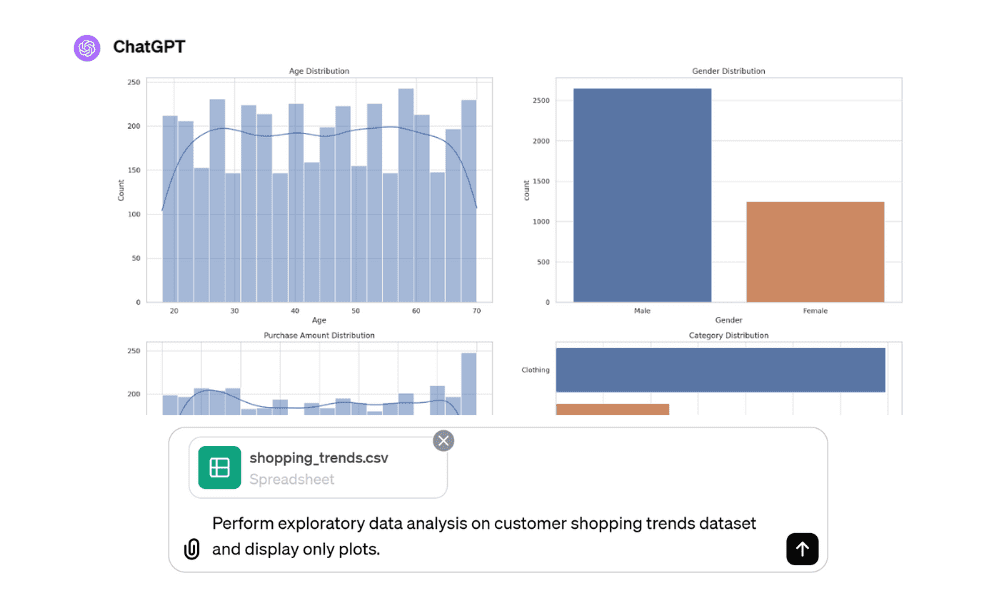
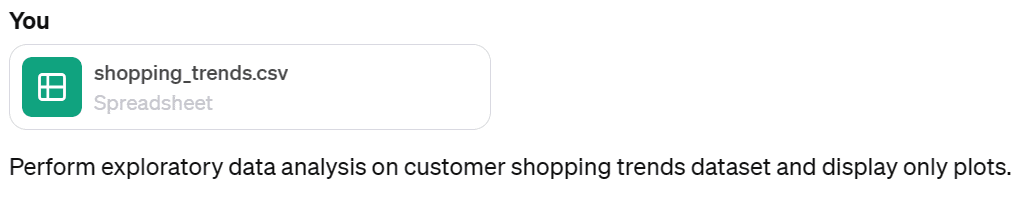
In our case, we are providing it with a Customer Shopping Trends dataset that offers valuable insights into consumer behavior and purchasing patterns.
Prompt: Perform exploratory data analysis on customer shopping trends dataset and display only plots.The ChatGPT delivered quick results, processing and analyzing consumer trends in under a minute, a task that typically takes at least 30 minutes for me to code and run.
You can improve the results by providing follow-up prompts regarding the type of visualization you are interested in.
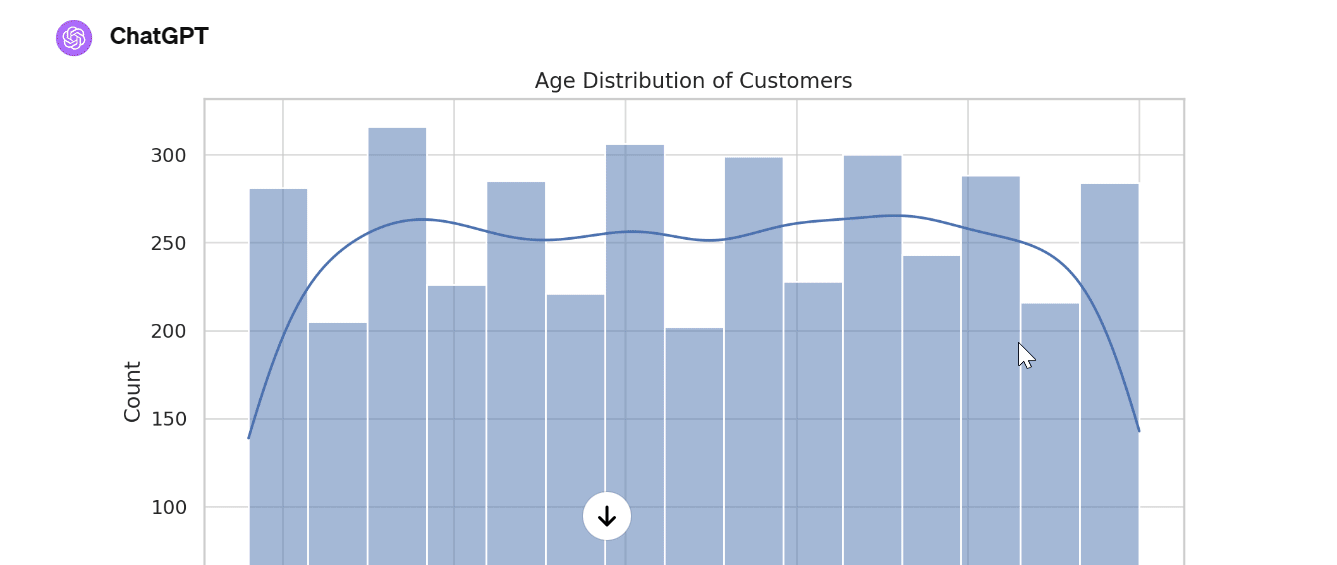
Prompt: Improve the analysis by plotting a correlation chart, bar chart, pie chart, boxplot, and relplot.
If you want to see multilevel complex visualization, you have to ask ChatGPT for it specifically.
Prompt: Use the dataset to plot various complex visualizations.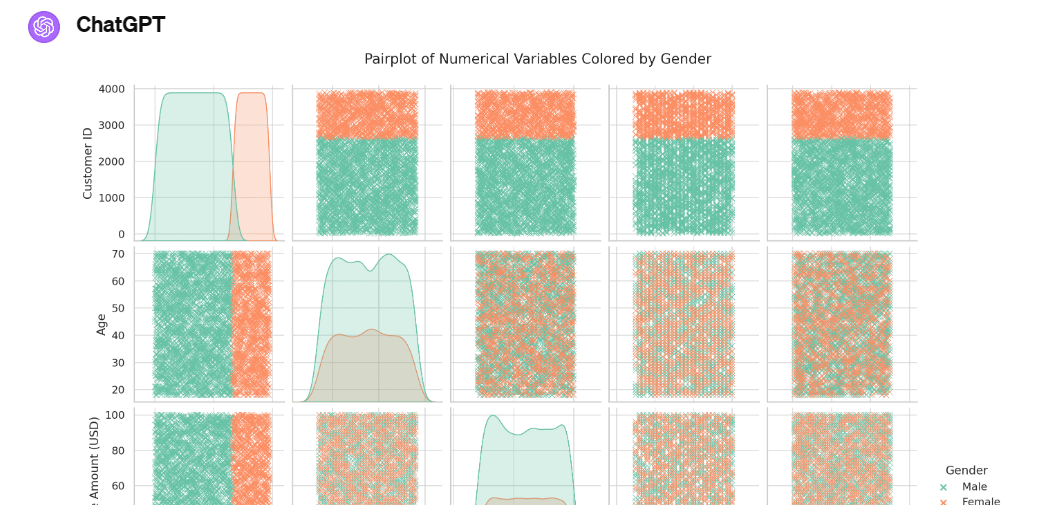
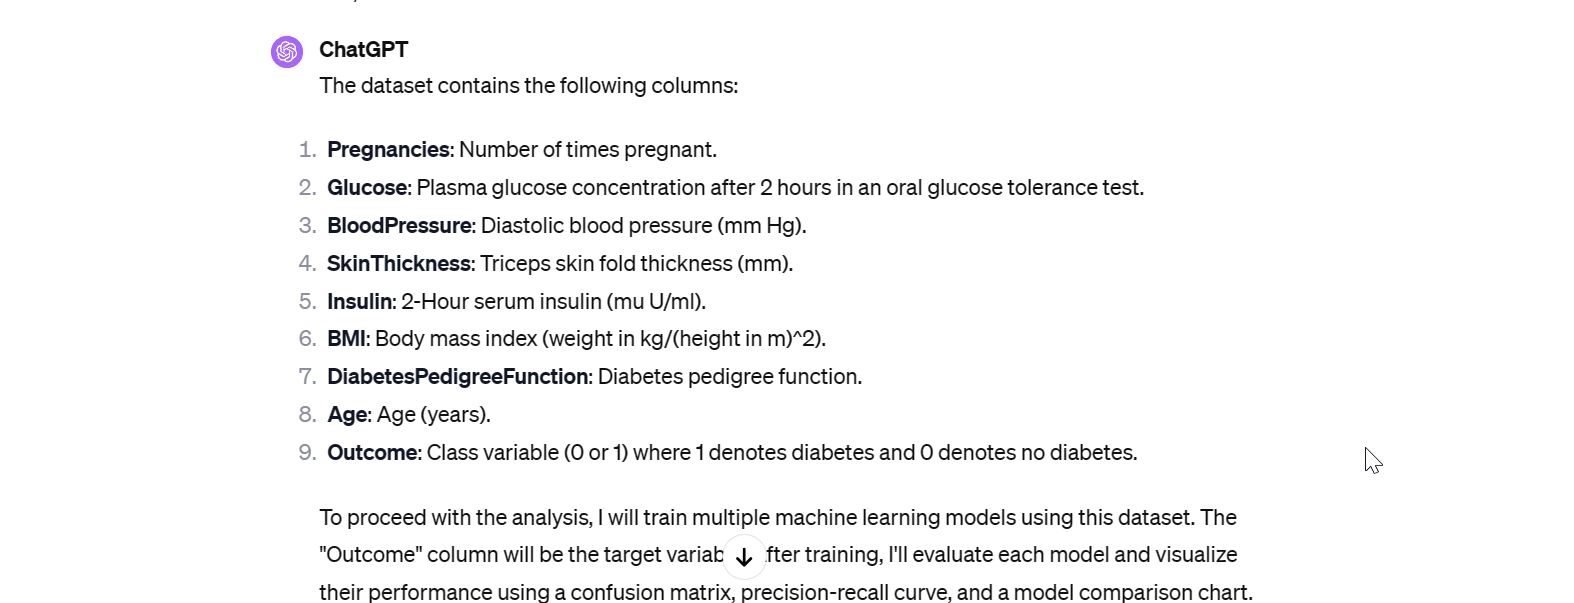
Data visualization plays a crucial role in evaluating models. In this section, we will be using the Diabetes Dataset from Kaggle and ask ChatGPT to train and evaluate multiple models. To make the most out of ChatGPT’s capabilities, we will request it to display a confusion matrix, precision-recall, and a chart comparing different models.
Prompt: Multiple machine learning models should be trained using the target column "Outcome", and the resulting model evaluation visualization should include a confusion matrix, precision-recall, and model comparison chart.It is evident that ChatGPT has performed exceptionally well. Although the models didn’t perform well on the dataset, we are impressed with its fast and accurate data visualization capabilities. It can be used to quickly analyze datasets or answer questions during interviews or take-home assignments.
ChatGPT has revolutionized how we can create data visualizations with ease. With its advanced data analysis capabilities, you can generate stunning and informative data viz in seconds using simple English prompts.
In this post, we have learned how ChatGPT can instantly produce various plots like pie charts, bar graphs, correlation matrices, and even complex visualizations like relplots on request.
ChatGPT also exceeded expectations when asked to train ML models on the diabetes dataset and generate evaluation metrics and comparison plots. The entire model building and visualization process took barely a minute.
Whether you need a simple bar chart, advanced model analysis, or just a quick way to understand datasets, ChatGPT delivers exceptional results with minimal effort. With capabilities improving every day, it’s an exciting time to level up your data viz skills using this AI assistant.
Abid Ali Awan (@1abidaliawan) is a certified data scientist professional who loves building machine learning models. Currently, he is focusing on content creation and writing technical blogs on machine learning and data science technologies. Abid holds a Master’s degree in Technology Management and a bachelor’s degree in Telecommunication Engineering. His vision is to build an AI product using a graph neural network for students struggling with mental illness.
- SEO Powered Content & PR Distribution. Get Amplified Today.
- PlatoData.Network Vertical Generative Ai. Empower Yourself. Access Here.
- PlatoAiStream. Web3 Intelligence. Knowledge Amplified. Access Here.
- PlatoESG. Carbon, CleanTech, Energy, Environment, Solar, Waste Management. Access Here.
- PlatoHealth. Biotech and Clinical Trials Intelligence. Access Here.
- Source: https://www.kdnuggets.com/create-stunning-data-viz-in-seconds-with-chatgpt?utm_source=rss&utm_medium=rss&utm_campaign=create-stunning-data-viz-in-seconds-with-chatgpt

