SNEAK PEEK
- Cardano (ADA) price analysis shows a bearish trend today as ADA breaks below $0.3000.
- The daily trading volume of Cardano is relatively low, making it difficult for bulls to reverse the bearish momentum.
- Technical indicators suggest that the bearish trend in Cardano prices could continue if buyers do not step in.
The recent Cardano price analysis indicates that cryptocurrency has been on a downward trajectory today as ADA broke below the $0.3000 mark. The bears have been dominating the market since yesterday, intensifying the selling pressure. This has resulted in a bearish trend in Cardano’s price movement as it corrects below the $0.3000 level.
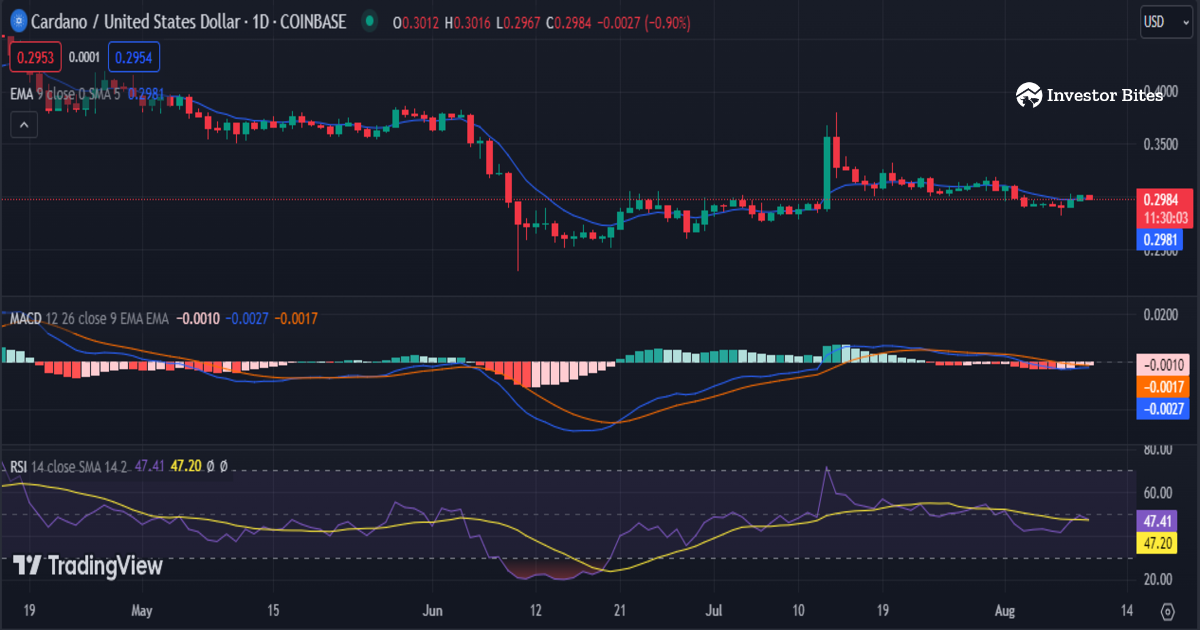
As of press time, Cardano is trading at $0.2981, displaying a loss of over 0.07% in the last 24 hours. ADA faced rejection at the $0.3019 level as selling pressure intensified due to low trading volume. The buyers must break the $0.3019 level to reverse the bearish trend and push ADA back above the $0.3000 mark. The support level at $0.2971 will likely be tested soon as bearish momentum continues to dominate the market.
The 24-hour trading volume of Cardano has also been relatively low, making it difficult for the bulls to push prices higher. The market capitalization has dropped today as holders have started selling their ADA tokens for a profit. This bearish trend in the price action is expected to continue further if the trading volume remains low and there are no major positive developments in the market.
The daily chart for Cardano price analysis shows a bearish pattern, which indicates that the cryptocurrency could face further declines in the coming sessions if the current trend holds. The red candlesticks indicate the selling pressure in the market, and this bearish trend could continue for some time if the buyers don’t step in.
On the technical front, Cardano is trading on the bearish side of the 9-day exponential moving average. The relative strength index also indicates a bearish trend, as it has dropped below 50. This suggests that the selling pressure will remain strong in the coming sessions.
The Moving Average Convergence Divergence (MACD) indicator is also bearish, as the MACD line has dropped below 0. This indicates that the bears dominate the market and control the ADA price movement. The red histogram indicates that the bearish trend will likely continue.
Cardano price analysis shows a bearish trend in ADA prices as they have corrected below the $0.3000 level. The cryptocurrency needs buyers to push prices higher if it wants to recoup its losses and break out of this downtrend. Until then, bearishness is expected to continue in the market.
Disclaimer: Cryptocurrency price is highly speculative and volatile and should not be considered financial advice. Past and current performance is not indicative of future results. Always research and consult with a financial advisor before making investment decisions.
- SEO Powered Content & PR Distribution. Get Amplified Today.
- PlatoData.Network Vertical Generative Ai. Empower Yourself. Access Here.
- PlatoAiStream. Web3 Intelligence. Knowledge Amplified. Access Here.
- PlatoESG. Automotive / EVs, Carbon, CleanTech, Energy, Environment, Solar, Waste Management. Access Here.
- PlatoHealth. Biotech and Clinical Trials Intelligence. Access Here.
- ChartPrime. Elevate your Trading Game with ChartPrime. Access Here.
- BlockOffsets. Modernizing Environmental Offset Ownership. Access Here.
- Source: https://investorbites.com/cardano-ada-price-analysis-10-08/

