
Stock
The Nifty made a fresh five-month high but gave up part of the intraday gains towards the end of the session on May 15. Bank Nifty and Nifty Financial indices closed at all-time highs on a weekly closing basis last week.
The Nifty is in continuation of an uptrend as it has not even breached its nearest moving average support of five-day EMA (exponential moving average), placed at 18,310. From last six out of seven weeks, the Nifty closed in the green. From the low of 16,828 made on March 20, 2023, the Nifty has seen a rise of almost 10 percent towards 18,458. The Nifty Smallcap index has been rising for the last seven consecutive weeks, and has registered a rally of more than 14 percent in this period.
From the derivatives perspective, there has been a significant Call writing happening at 18,500 strike price in the weekly expiry, which could offer a resistance in the Nifty for the short term. Short term support has shifted up near 18,200, which can be kept as a stop-loss in trading long positions of Nifty.
Close below 18,200 would confirm the short-term bearish trend reversal. India VIX continued to remain near the historically lower band, which indicates lower volatility and stable prices for the Nifty50 stocks.
Considering the evidences discussed above, we believe that Nifty should be held long with trailing stop-loss of 18,200. On the upside, 18,500 is strong resistance for Nifty, sustaining above which rally could extend towards all time high of 18,887.
Here are three buy calls for next 2-3 weeks:
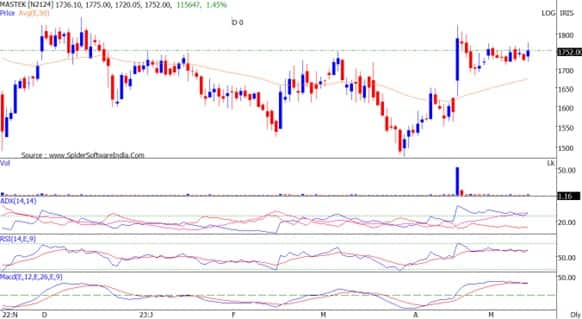
Mastek: Buy | LTP: Rs 1,751 | Stop-Loss: Rs 1,600 | Targets: Rs 1,890-2,000 | Return: 14 percent
On the week ended April 21, 2023, the stock price broke out from consolidation with significant jump in volumes. On May 2, 2022, the stock resumed its uptrend after running correction from recent swing high.
It is placed above its 20, 50 and 100-day EMA. Indicators and oscillators like MACD (moving average convergence divergence) and RSI (relative strength index) have turned bullish on its weekly charts. IT sector has started its outperformance after long time.
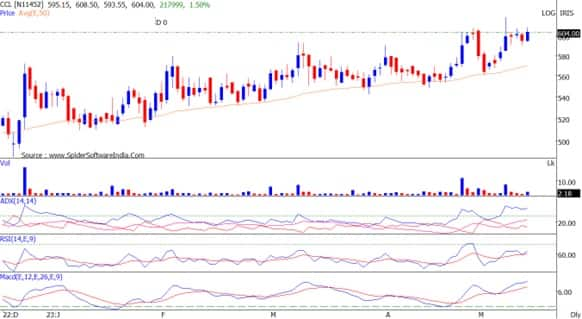
CCL Products: Buy | LTP: Rs 606.50 | Stop-Loss: Rs 548 | Target: Rs 680 | Return: 12 percent
Primary trend of the stock has been bullish as it has been forming higher tops and higher bottoms on weekly charts. Stock price has been finding support on its 50-day EMA.
The stock has broken out from symmetrical triangle on the daily chart and registered new all time high. Price rise is accompanied by jump in volumes. Indicators and oscillators have turned bullish on daily and weekly charts.
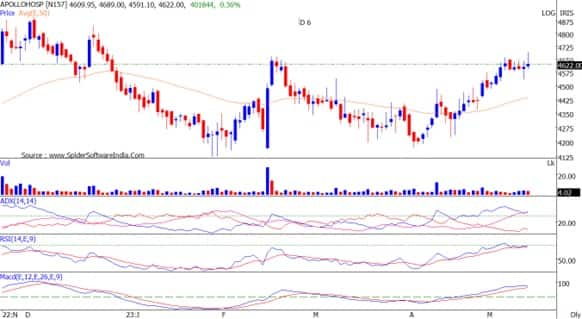
Apollo Hospitals Enterprises: Buy | LTP: Rs 4,626 | Stop-Loss: Rs 4,370 | Targets: Rs 4,940-5,150 | Return: 11 percent
Triple Bottom Formation is expected at Rs 4,150 odd levels on the weekly charts. Stock price has been rising for last three weeks with rising volumes. Stock price has broken out from downward sloping trend line on the weekly charts.
Stock is placed above all important moving averages, indicating bullish trend on all time frame. Indicators and oscillators like MACD and RSI have turned bullish on its weekly charts.
Disclaimer: The views and investment tips expressed by investment experts on Moneycontrol.com are their own and not those of the website or its management. Moneycontrol.com advises users to check with certified experts before taking any investment decisions.
- SEO Powered Content & PR Distribution. Get Amplified Today.
- PlatoAiStream. Web3 Data Intelligence. Knowledge Amplified. Access Here.
- Minting the Future w Adryenn Ashley. Access Here.
- Buy and Sell Shares in PRE-IPO Companies with PREIPO®. Access Here.
- Source: https://www.moneycontrol.com/news/technicals/hot-stocks-|-ccl-products-mastek-apollo-hospitals-can-fetch-double-digit-returnsshort-term_17004721.html

