Published 19 hours ago
For nearly a month, the XRP price has been steadily rising under the influence of an inverted flag pattern. Moreover, the coin price is currently resting at the pattern’s support trendline and shows signs of a bullish reversal. A bull cycle within this pattern may trigger a temporary rally, but is it wise to enter now?
advertisement
Key points:
- An ascending trendline assists the XRP buyers in maintaining a bullish rally
- The 50-day EMA act as a dynamic resistance for rising prices
- The intraday trading volume in the XRP is $527.2 Million, indicating a 30% loss.
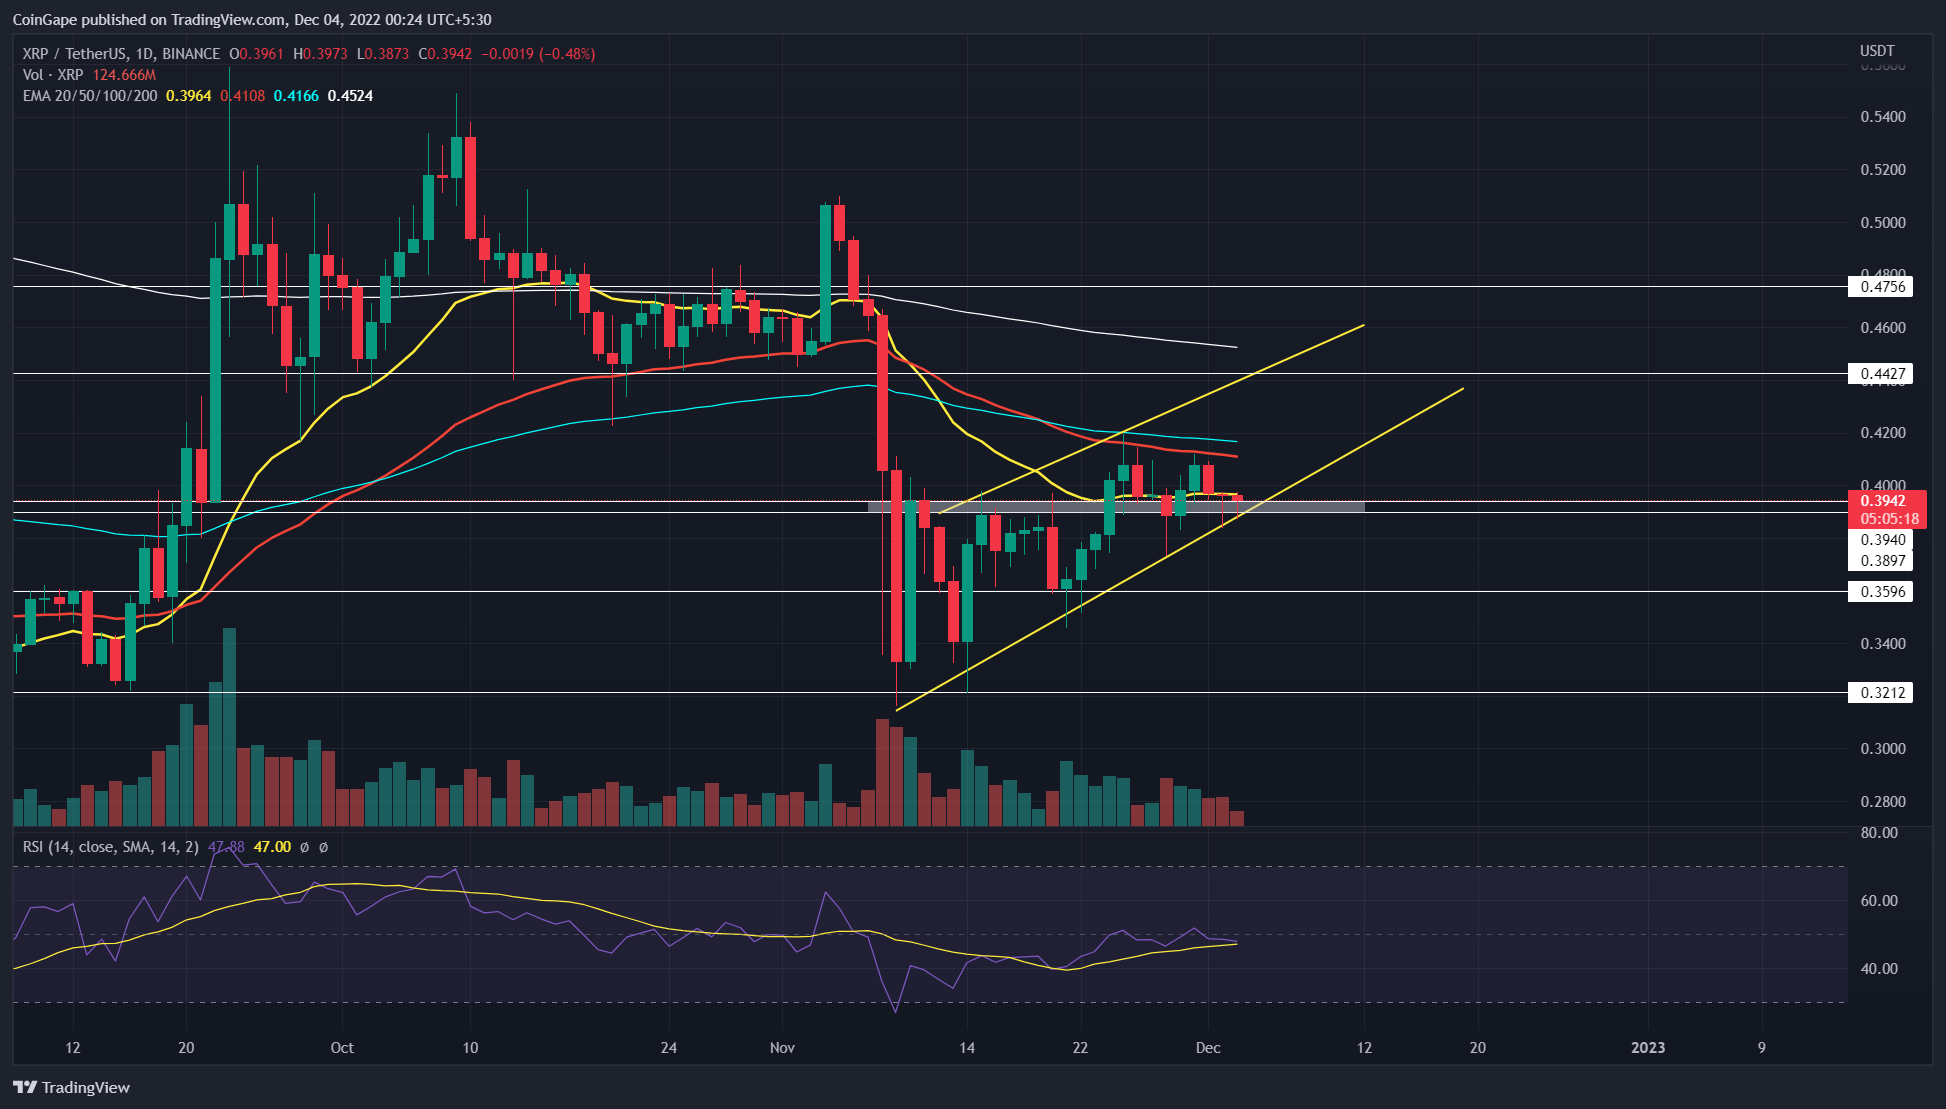
Source- Tradingview
Despite the recent consolidation in the crypto market, the XRP price continues to follow an inverted flag pattern. The coin price has already tested the resistance trendline twice and the support trendline multiple times, indicating the traders actively respond to this pattern.
In theory, this bearish continuation pattern offers a minor upward pullback in an established downtrend. The support trendline is crucial in this pattern, as its breakdown will be the key signal for the downtrend continuation.
Trending Stories
By the press time, the XRP price trades at $0.393 with an 0.63% intraday loss. However, the long-tail rejection candle at combined support of $0.39 and ascending trendline increases the likelihood of a bullish reversal.
The possible bullish reversal within this pattern may drive the prices 12.5% higher to reach the $0.443 resistance.
However, a gradual loss of volume activity despite the rising price suggests the ongoing rally is temporary. Thus, in response to this pattern, the XRP price is expected to eventually break the support trendline. This development will replenish the bearish momentum and plummet the prices to $0.36.
Technical Indicator
EMAs: the XRP price trading below the crucial EMAs(20, 50, 100, and 200) indicates the bear still has trend control. In addition, each of these EMAs may act as an individual resistance to stall the bullish growth.
advertisement
Relative Strength Index: The daily-RSI slope wobbling around the midline slope indicates a neutral outlook for the XRP price.
XRP intraday price levels
- Spot price: $0.393
- Trend: Bearish
- Volatility: High
- Resistance level- $0.443 and $0.475
- Support level- $0.39 and 0.36
Share this article on:
The presented content may include the personal opinion of the author and is subject to market condition. Do your market research before investing in cryptocurrencies. The author or the publication does not hold any responsibility for your personal financial loss.
- SEO Powered Content & PR Distribution. Get Amplified Today.
- Platoblockchain. Web3 Metaverse Intelligence. Knowledge Amplified. Access Here.
- Source: https://coingape.com/markets/this-chart-pattern-sets-xrp-price-for-12-jump-worth-buying/

