- Tesla stock shed more than 12% on Thursday after missing on the top and bottom lines.
- Q4 results showed further weakness on the demand front as revenue growth slows.
- Revenue rose just 3.5% from a year ago for the EV leader.
- Wedbush Securities cuts price target from $350 to $310.
Tesla (TSLA) stock plummeted 12.13% on Thursday, the electric vehicle (EV) company’s worst outing, percentage-wise, since January 3, 2023. Reaction to late Wednesday’s fourth-quarter results and subsequent dour 2024 outlook led to a rout for the company run by CEO Elon Musk.
Tesla stock closed at $182.63, a price level investors haven’t seen since May of last year. The rest of the market left Tesla behind as US GDP outperformance reported for Q4 sent equities rallying. The NASDAQ Composite closed up 0.18%, while the Dow Jones was helped by IBM (IBM) results to power 0.64% higher.
Tesla stock earnings news: Management focuses on future, while 2024 outlook appears vague
Tesla earned $0.71 per adjusted share, a 3 cent miss for the fourth quarter, and underperformed its revenue consensus by nearly $600 million.
Revenue rose 3.5% from a year ago, which was viewed as a major slowdown for a company known for regularly seeing annual sales growth of more than 30%. For instance, in the fourth quarter of 2022, revenue rose 37% YoY. But price cuts across Tesla’s various models reduced revenues throughout 2023, cutting into the fourth quarter’s top line.
One highlight from the quarter was that free cash flow grew from $1.42 billion one year ago to $2.06 billion. However, capex trended higher from $1.86 billion a year ago to $2.3 billion in the fourth quarter. Management said that capex in 2024 would increase to $10 billion.
Analysts were nonplussed by the management team’s uncertainty regarding its outlook for 2024. Gone were the normal absurdly ambitious projections from Musk. Instead, Musk and other executives focused on the company’s broad outlines for its AI and robotics units.
Even the bulls’ bull, Wedbush analyst Dan Ives, cut his price target from $350 to $310, citing near-term uncertainty regarding automotive demand. Ives called the conference call a “train wreck”. Roth MKM analyst Craig Irwin, a noted bear, reiterated his price target of $85.
“We continue to see Tesla’s stock as egregiously overvalued,” Irwin wrote.
Much of the discussion dealt with Musk’s pressuring of the board to grant him 25% ownership of the company, and Musk brought up the possibility of a dual-class stock structure.
EV stocks FAQs
Electric vehicles or EVs are automobiles that use rechargable batteries and electric motors to accelerate rather than internal combustion engines (ICEs). They have been around for more that 100 years, but battery technology research & development was meager for much of the 20th century. Lithium-ion battery technology became advanced enough to produce EVs at scale in the late 1990s and 2000s, and sales have been steadily increasing since then Tesla’s Roadster was unveiled in 2008. EVs are viewed as a means of reducing carbon emissions since battery electric vehicles (BEVs) themselves produce zero emissions. Other vehicles called plug-in hybrid electric vehicles (PHEVs) utilize both battery electric power and ICEs as a backup.
EVs are growing from a small base, but they rose from 9% of global new auto sales in 2021 to 14% of the total in 2022. This was a 65% YoY growth rate, and the industry delivered 10.2 million EVs worldwide in 2022. Projections show this number climbing above 16 million in 2023. Across the world, market shares differ greatly among nations. Nearly 88% of Norwegian new car sales in 2022 were EVs. On the other hand, the United States, where much of the modern innovation in EVs was forged, had less than 8% of new vehicle sales go to EVs in 2022. The largest EV market in the world, China, saw 30% of the market go to EVs that year.
We know you’re thinking Elon Musk, but he’s probably more like the father of the mass-market, contemporary EV. All the way back in 1827, a Hungarian priest named Anyos Jedlik invented the electric motor and used it the following year to power a vehicle of sorts. French scientist Gaston Planté invented the lead-acid battery in 1859, and German engineer Andreas Flocken built the first true electric car for the public in 1888. EVs made up about 38% of all vehicles sold in the US around 1900. They began losing market share rapidly after 1910 when gasoline-powered vehicles grew much more affordable. They largely died off until new research programs in the 1990s led to gradual private sector investment in the 2000s.
China’s BYD is by far the largest manufacturer of EVs in the world. In 2022 it sold 1.8 million EVs and in the second half of the year made up 20% of the global market. The asterisk given to BYD is that the vast majority of these vehicles are hybrids. Tesla’s 12% market share is often treated as more significant than BYD, because it only sells BEVs and is the most famous EV brand in the world. Volkswagen, BMW and Wuling then round out the top five. As a new sector with heavy investment though, many startups have flooded the market. These include China’s Nio, Li Auto and Xpeng; a Swedish-Chinese manufacturer called Polestar; and Lucid and Rivian from the US.
Tesla stock forecast
Tesla stock saw volumes rise 68% on Thursday above the usual 117 million shares exchanging hands, nearly eclipsing 200 million in the regular session. The only near certainty is that TSLA stock will continue this downtrend. The only question is when and where the bottom is found.
Tesla stock sank to a price level last seen in May, and normally positive analysts like Adam Jonas of Morgan Stanley said the lack of guidance specifics would likely weigh on TSLA stock at the start of the year.
Both bears and bulls will focus on two historical support levels. These are $167.50 and $154. The $167.50 level supported reduced demand for TSLA stock in March and May of 2023. $154 was the ultimate bottom during that downtrend that reached a nadir that April.
Of note, the weekly chart shows the 13-week Simple Moving Average trending below its 26-week counterpart since last October. This means that the weekly chart has been telegraphing weakness in TSLA price action for some time. Now the distance between those moving averages will expand. It could take a few weeks for consolidation to set in despite the fact that TSLA stock has already reached oversold conditions on the daily chart.
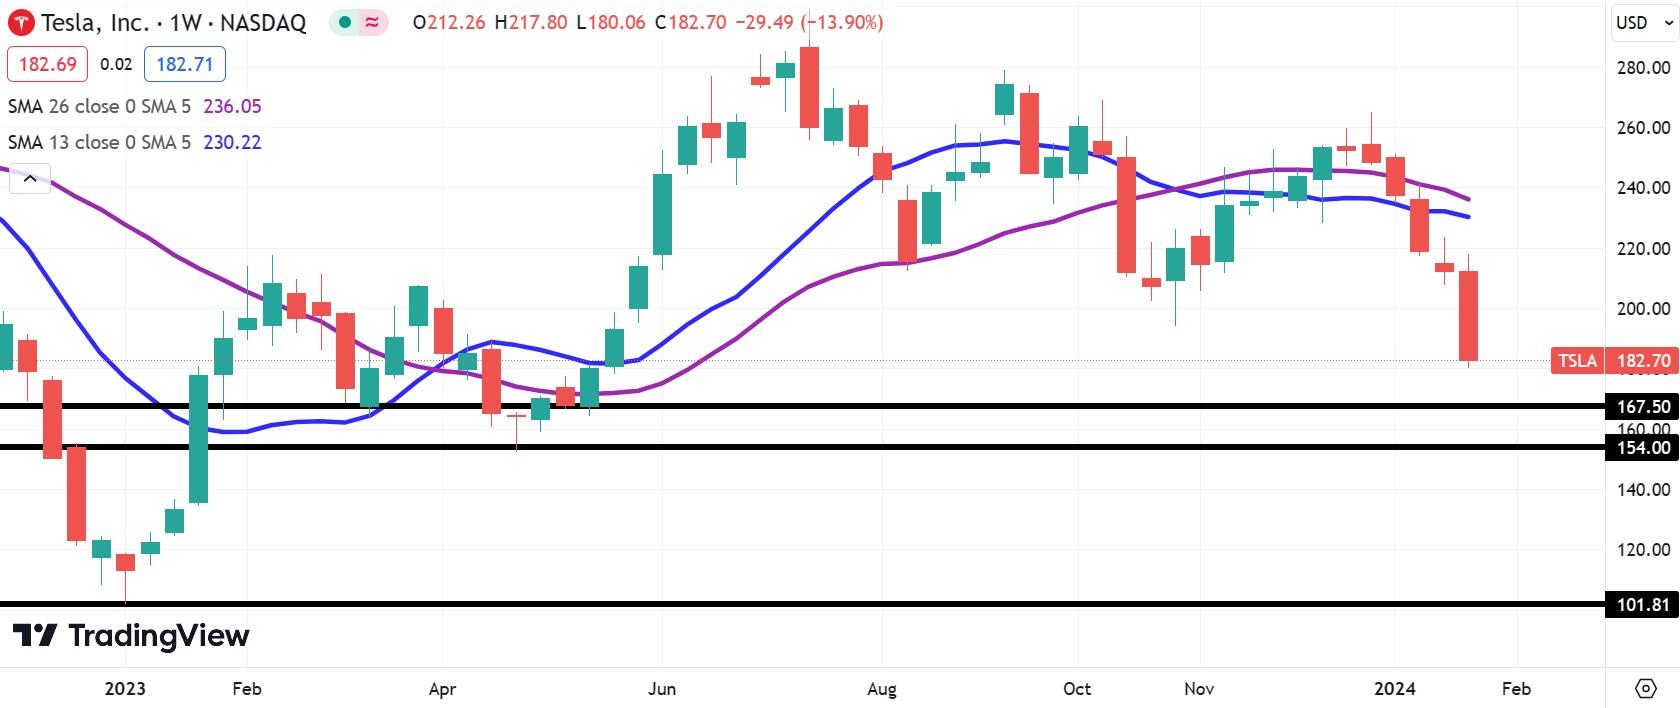
TSLA weekly stock chart
- SEO Powered Content & PR Distribution. Get Amplified Today.
- PlatoData.Network Vertical Generative Ai. Empower Yourself. Access Here.
- PlatoAiStream. Web3 Intelligence. Knowledge Amplified. Access Here.
- PlatoESG. Carbon, CleanTech, Energy, Environment, Solar, Waste Management. Access Here.
- PlatoHealth. Biotech and Clinical Trials Intelligence. Access Here.
- Source: https://www.fxstreet.com/news/tesla-stock-news-tsla-suffers-worst-day-in-more-than-a-year-as-2024-outlook-uncertain-202401252302

