Tag: declines
When will the heartland embrace electric vehicles?
As national charging infrastructure is created, coastal America still dominates EV registrations
With USD5 billion in electric vehicle charging network funds (and more to come) available under the Bipartisan Infrastructure Law, states are lining up for their share of federal largesse.
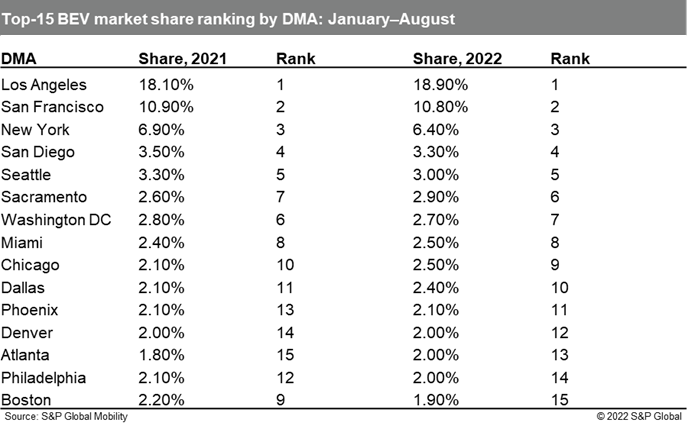
However, outside of the large coastal cities, retail registrations of EVs have yet to take hold, according to new analysis from S&P Global Mobility. The top-eight EV markets in the US are all in coastal states, and represent 50.5% of total EV registrations in 2022. The greater Los Angeles and San Francisco metropolitan areas* alone account for nearly one-third of total share of the US EV market.
While the 22 heartland states** represent 27.1% of total US
vehicle retail sales through August, their representation in EV
adoption has remained stagnant from 2021 into this year—at a
tepid 15.5% share. Only Colorado and Nevada (and to a minuscule
extent, Utah) outpunch their overall retail share in EV
representation, according to S&P Global Mobility data.

Coastal dominance
It is no surprise that California, a leader in green initiatives and EV adoption, dominates the top of share rankings. Greater Los Angeles (18.9% share of total EV sales), the San Francisco Bay Area (10.8%), and San Diego (3.3%) saw no change in their top-five position year-over-year when comparing rankings for calendar year to date (CYTD: January-August) 2022 versus 2021, while Sacramento improved its position from the previous year.
Additionally, of the 13 markets that increased share for CYTD 2022 versus 2021, most were in the "smile" states***, including Atlanta, Austin, Dallas, and Houston. Only Chicago, Las Vegas, Missoula, and Salt Lake City represented share gains in big cities of "Heartland" states. Not all coastal markets are guaranteed share gains; New York and Boston registered slight EV share declines this year.
"BEV market share control on the two coasts is attributed to
their higher mix of early adopters compared to buyers in middle
America," said Tom Libby, associate director of Loyalty Solutions
and Industry Analysis at S&P Global Mobility. "Their
demographic profile is more in sync with the traditional BEV buyer
than the middle-American profile."
But Libby sees potential in EV growth in top heartland markets: "More acceptance and much broader consumer awareness is resulting
in a natural progression of adoption from the coasts to the
Heartland."
A chicken-and-egg scenario might also be in play. The coastal cities have worked harder at creating charging infrastructures, as well as incentives for homeowners to install charging equipment in their garages.
"There is no doubt that the lack of charger availability is an influence in midwestern states, but it is not the factor," said James Martin, associate director of consulting for S&P Global Mobility. "An equally strong factor is the availability of product in form factors that customers are willing to purchase.
"There was no real option in terms of family friendly, moderately priced CUVs," Martin added. "And some models, such as the Hyundai Kona EV, were initially not available in midwestern states - based on OEMs deciding to focus on Section 177 (CARB) states where automakers could accumulate credits. Now automakers are beginning to produce more mainstream electric vehicles. Availability of these vehicles will most likely be a factor in spurring installation of more charging infrastructure."
With the BIL and Inflation Reduction Act (IRA) laws passed, more nationwide tax incentives will be available. The state receiving the most funds of the initial USD900-million tranche will be Texas—even though its major city with the most market share is Dallas, with a mere 2.4% chunk of the EV market (8,591 EVs retailed through August). Texas may be gambling that more charging infrastructure will spur EV demand in the state.
Heartland buyer profiles
Is there any difference in the buyer profile between coastal and heartland America
Yes and no.
According to S&P Global Mobility loyalty analytics data, which tracks buyers' return-to-market behavior, there is little difference in the demographic and psychographic profile of those moving into battery-electric vehicles.
Comparing inflow movement into BEVs from coastal market share leaders (Los Angeles, New York, Sacramento, San Diego, San Francisco, and Seattle) versus inland market share gainers (Atlanta, Austin, Chicago, Dallas, Houston, Missoula, Salt Lake City) shows few differences in the buyer cohorts. There are just more of those types of people in Coastal and Smile states.
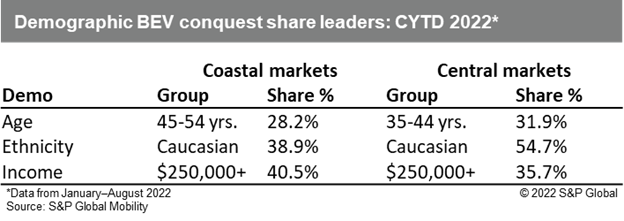
Caucasian buyers with high household incomes dominate both regions' adopter bases. The only difference is that the central markets skew more toward a slightly younger demographic.
Year-over-year comparisons between the two regions show similar results; both reflect the largest declines in share from Caucasian buyers and the highest gain from Asian-American buyers. The jump in inflow from Asian-American buyers signals the early adoption of this technology was not a passing phase.
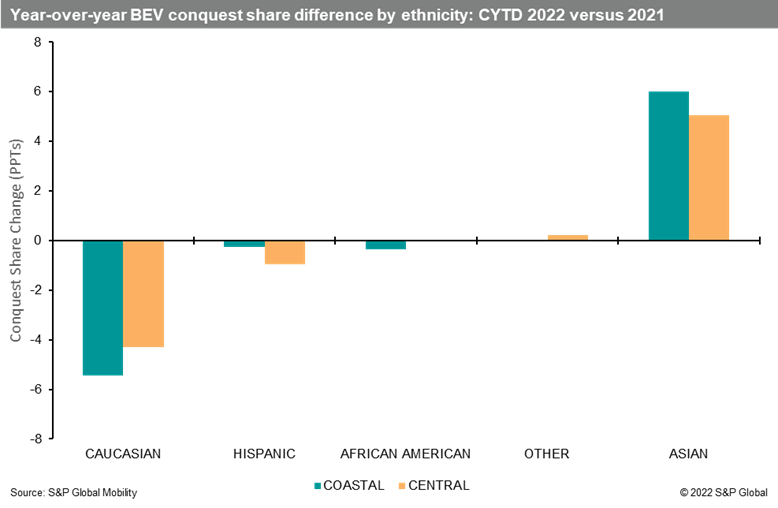
"The typical Asian-American new-vehicle buyer is younger than that of any other ethnicity, including African-American and Hispanic," Libby said. "Through the first eight months of 2022, 48% of Asian-American buyers were age 18-44. Younger buyers typically are more open to new ideas and products; their brand loyalty typically is lower than that of most other age groups."
Is there a difference in brand preference between coastal and heartland buyers? Tesla's dominance remains unchanged because it controls over 65% of all BEV conquest share in both areas. The brand's public perception as the preminent BEV manufacturer solidified its position as the first choice of buyers willing to move from an internal combustion engine (ICE) vehicle to a BEV.
However, the year-over-year change in conquest share shows that demand for Tesla appears to be slowing down in the heartland markets. Both Kia and Hyundai were the leaders in market share gain, improving their position by more than 2 percentage points - even though the budget-conscious Hyundai Ioniq5 is sold in only 39 states. Mercedes-Benz, Rivian, and Ford were the other brands to appear among the top-five largest heartland gainers for CYTD 2022 versus 2021.
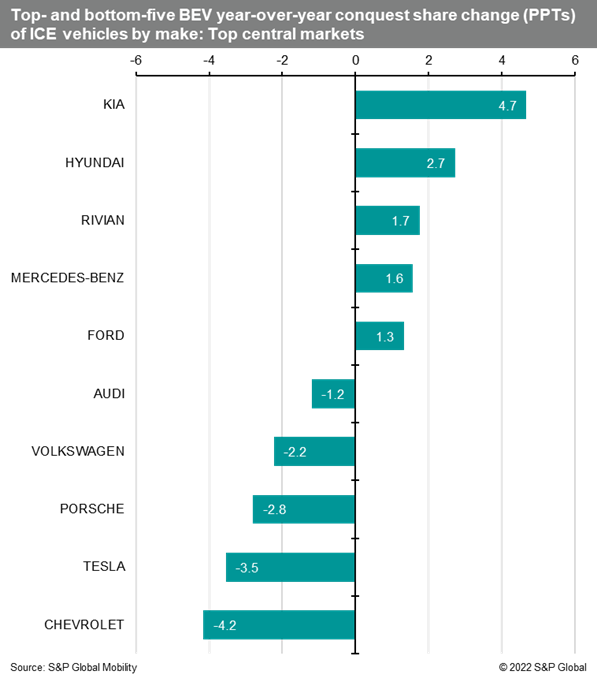
The increased interest in the Korean brands coincides with a decrease among more established BEV manufacturers. However, that may not necessarily represent a drop in demand. For instance, Volkswagen has seen sizeable registration declines in 2022 for its ID.4—mostly owing to supply chain snarls and market allocations to more EV-friendly regions. However, VW's new ID.4 assembly line in Tennessee went live in October, and the automaker says it has 20,000 unfilled reservations and a plant capacity of 7,000 units per month.
Acceptance of BEVs is moving inward in America, albeit at a slower pace than expected. Libby believes it will take time before electrification is fully embraced in the heartland.
"The adoption of BEVs is a long-term process that needs to reach
an inflection point similar to the adoption, or acceptance, of
Asian-sourced vehicles in the US," Libby says. "That inflection
point is when the product becomes generally accepted and it usually
occurs when volume and exposure reach a level that influences all
the reluctant outliers."
----
* Given their fluid geography and county boundaries, "Greater Los Angeles" includes the contiguous Los Angeles, Orange, Riverside, and San Bernardino counties. "San Francisco Bay Area" includes the Bay Area of San Mateo, Santa Clara, Alameda, Contra Costa, Solano, Napa, Sonoma, and Marin counties.
** For this calculation, S&P Global Mobility analysts categorized heartland states as Arkansas, Colorado, Idaho, Illinois, Iowa, Kansas, Kentucky, Michigan, Minnesota, Missouri, Montana, Nebraska, Nevada, North Dakota, Ohio, Oklahoma, South Dakota, Tennessee, Utah, West Virginia, Wisconsin, and Wyoming.
*** Smile States are categorized as starting in California in the west, swinging through the Sun Belt and Southern coastal states, then swinging up the Atlantic coast to Virginia.Please contact automotive@spglobal.com to find out more information around our insights to help you make data-driven decisions with conviction.
Automotive Insights – Canadian EV Information and Analysis Q3 2022
Highlights
- In Canada, trends in zero-emission vehicles (ZEV = BEV and PHEV) picked up dramatically for all light vehicle registrations as of quarter 3 2022.
- ZEVs account for one out of every 12 new vehicles registered in Canada. ZEVs market share increased to 8.4% for 2022, up from 5.3% in the previous period.
- The market share of battery electric vehicles (BEV) increased to 6.5%, with volume increasing by 56.0% year over year. Year over year, total ZEV volume increased by 38.8%.

National Enhanced Fuel Type Trend
When compared to Q3 2021 year to date, new vehicle registrations have fallen by 12.5% overall and the combined volume of xEV light vehicles (EV/PHEV/HEV/ FCEV) increased by 14.7% as of Q3 2022. xEVs now account for 15.2% of all new registrations; while traditional ICE vehicles account for 84.8%.
Further comparisons of Q3 2022 against the previous year show BEVs and PHEVs saw volume gains (25,368 and 287), while HEV and FCEV each saw volume declines.
Inventory constraints continue to play a role on new vehicle registrations. Despite the constraints, BEV adoption rates continue to increase and have doubled from Q3 2021 (3.7%).
Download the full Canadian EV Insights report and sign up to receive future installments
Blues for America
 Recently my wife Janet and I splurged on tickets to a spellbinding concert by the Lincoln Center Jazz Orchestra. The music was memorable, but a comment by orchestra leader and trumpet virtuoso Wynton Marsalis proved even more so. Marsalis introduced a blues number with the seemingly off-hand suggestion that the blues should be America’s national […]
The post Blues for America appeared first on Post Carbon Institute.
Latest Intelligence

