- Bullish SUI price prediction for 2024 is $1.2363 to $2.0141.
- Sui (SUI) price might reach $3 soon.
- Bearish SUI price prediction for 2024 is $0.5147.
In this Sui (SUI) price prediction 2024, 2025-2030, we will analyze the price patterns of SUI by using accurate trader-friendly technical analysis indicators and predict the future movement of the cryptocurrency.
|
TABLE OF CONTENTS |
|
INTRODUCTION |
|
|
SUI (SUI) PRICE PREDICTION 2024 |
|
| SUI (SUI) PRICE PREDICTION 2025, 2026-2030 |
| CONCLUSION |
| FAQ |
Sui (SUI) Current Market Status
| Current Price | $1.34 | 24 – Hour Price Change | 10.94% Up |
| 24 – Hour Trading Volume | $1,122,905,823 |
| Market Cap | $1,473,235,440 |
| Circulating Supply | 1,100,947,215 SUI | All – Time High | $1.72 (On May 03, 2023) |
| All – Time Low | $0.5142 (On Aug 17, 2023) |
(Source: CoinMarketCap)
What is Sui (SUI)
| TICKER | SUI |
| BLOCKCHAIN | Sui |
| CATEGORY | Decentralized Layer 1 Blockchain |
| LAUNCHED ON | May 2023 |
| UTILITIES | Governance, security, gas fees & rewards |
Sui is a smart contract platform maintained by a permissionless set of validators that play a role similar to validators or miners in other blockchain systems. It has a native token called SUI, used to pay for gas, and users can stake their SUI tokens with validators in a Delegated Proof-of-Stake model within an epoch. It takes a significant leap in scalability by enabling parallel agreement on casually independent transactions.
Sui 24H Technicals
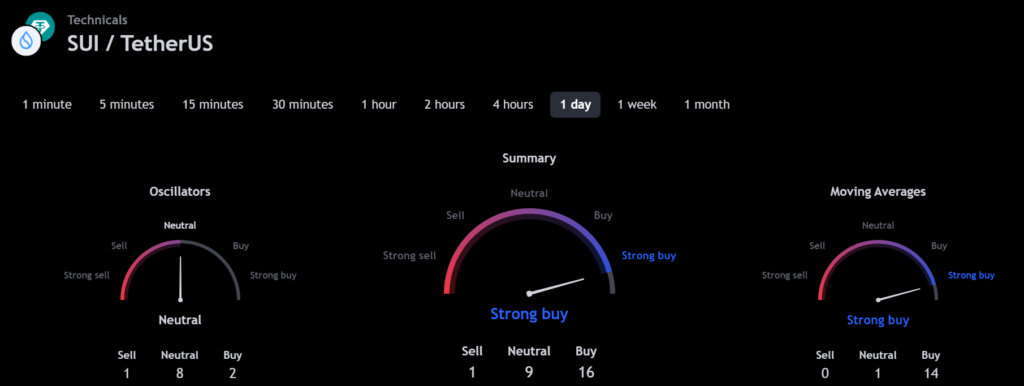
(Source: TradingView)
Sui (SUI) Price Prediction 2024
Sui (SUI) ranks 52nd on CoinMarketCap in terms of its market capitalization. The overview of the Sui price prediction for 2024 is explained below with a daily time frame.
SUI/USDT Ascending Channel Pattern (Source: TradingView)
In the above chart, Sui (SUI) laid out an ascending channel pattern. An ascending channel is the price action contained between upward-sloping parallel lines. Higher highs and higher lows characterize this price pattern. An ascending channel is used to show an uptrend in a security’s price. Ascending channels are short-term bullish in that a stock moves higher within an ascending channel, but these patterns often form within longer-term downtrends as continuation patterns.
At the time of analysis, the price of Sui (SUI) was recorded at $1.34. If the pattern trend continues, then the price of SUI might reach the resistance levels of $1.2268, and $1.9816. If the trend reverses, then the price of SUI may fall to the support of $0.8950, and $0.7644.
Sui (SUI) Resistance and Support Levels
The chart given below elucidates the possible resistance and support levels of Sui (SUI) in 2024.
SUI/USDT Resistance and Support Levels (Source: TradingView)
From the above chart, we can analyze and identify the following as the resistance and support levels of Sui (SUI) for 2024.
| Resistance Level 1 | $1.2363 |
| Resistance Level 2 | $2.0141 |
| Support Level 1 | $0.7639 |
| Support Level 2 | $0.5147 |
SUI Resistance & Support Levels
Sui (SUI) Price Prediction 2024 — RVOL, MA, and RSI
The technical analysis indicators such as Relative Volume (RVOL), Moving Average (MA), and Relative Strength Index (RSI) of Sui (SUI) are shown in the chart below.
SUI/USDT RVOL, MA, RSI (Source: TradingView)
From the readings on the chart above, we can make the following inferences regarding the current Sui (SUI) market in 2024.
| INDICATOR | PURPOSE | READING | INFERENCE |
| 50-Day Moving Average (50MA) | Nature of the current trend by comparing the average price over 50 days | 50 MA = $0.7437Price = $1.723 (50MA < Price) |
Bullish (Uptrend) |
| Relative Strength Index (RSI) | Magnitude of price change;Analyzing oversold & overbought conditions | 72.4785 <30 = Oversold 50-70 = Neutral>70 = Overbought |
Overbought |
| Relative Volume (RVOL) | Asset’s trading volume in relation to its recent average volumes | Below cutoff line | Weak Volume |
Sui (SUI) Price Prediction 2024 — ADX, RVI
In the below chart, we analyze the strength and volatility of Sui (SUI) using the following technical analysis indicators — Average Directional Index (ADX) and Relative Volatility Index (RVI).
SUI/USDT ADX, RVI (Source: TradingView)
From the readings on the chart above, we can make the following inferences regarding the price momentum of Sui (SUI).
| INDICATOR | PURPOSE | READING | INFERENCE |
| Average Directional Index (ADX) | Strength of the trend momentum | 21.9141 | Weak Trend |
| Relative Volatility Index (RVI) | Volatility over a specific period | 54.51
<50 = Low |
High Volatility |
Comparison of SUI with BTC, ETH
Let us now compare the price movements of Sui (SUI) with that of Bitcoin (BTC), and Ethereum (ETH).
BTC Vs ETH Vs SUI Price Comparison (Source: TradingView)
From the above chart, we can interpret that the price action of SUI is similar to that of BTC and ETH. That is, when the price of BTC and ETH increases or decreases, the price of SUI also increases or decreases respectively.
Sui (SUI) Price Prediction 2025, 2026 – 2030
With the help of the aforementioned technical analysis indicators and trend patterns, let us predict the price of Sui (SUI) between 2025, 2026, 2027, 2028, 2029 and 2030.
| Year | Bullish Price | Bearish Price |
| Sui (SUI) Price Prediction 2025 | $5 | $0.5 |
| Sui (SUI) Price Prediction 2026 | $8 | $0.4 |
| Sui (SUI) Price Prediction 2027 | $11 | $0.3 |
| Sui (SUI) Price Prediction 2028 | $13 | $0.2 |
| Sui (SUI) Price Prediction 2029 | $15 | $0.1 |
| Sui (SUI) Price Prediction 2030 | $17 | $0.09 |
Conclusion
If Sui (SUI) establishes itself as a good investment in 2024, this year would be favorable to the cryptocurrency. In conclusion, the bullish Sui (SUI) price prediction for 2024 is $2.0141. Comparatively, the bearish Sui (SUI) price prediction for 2024 is $0.5147.
If there is a positive elevation in the market momentum and investors’ sentiment, then Sui (SUI) might hit $3. Furthermore, with future upgrades and advancements in the Sui ecosystem, SUI might surpass its current all-time high (ATH) of $1.72 and mark its new ATH.
FAQ
1. What is Sui (SUI)?
Sui is a smart contract platform maintained by a permissionless set of validators that play a role similar to validators or miners in other blockchain systems.
2. Where can you buy Sui (SUI)?
Traders can trade Sui (SUI) on the following cryptocurrency exchanges such as Binance, OKX, Bybit, Bitunix, and DigiFinex.
3. Will Sui (SUI) record a new ATH soon?
With the ongoing developments and upgrades within the Sui platform, Sui (SUI) has a high possibility of reaching its ATH soon.
4. What is the current all-time high (ATH) of Sui (SUI)?
Sui (SUI) hit its current all-time high (ATH) of $1.72 on May 03, 2023.
5. What is the lowest price of Sui (SUI)?
According to CoinMarketCap, SUI hit its all-time low (ATL) of $0.558 on June 10, 2023.
6. Will Sui (SUI) hit $3?
If Sui (SUI) becomes one of the active cryptocurrencies that majorly maintain a bullish trend, it might rally to hit $3 soon.
7. What will be the Sui (SUI) price by 2025?
Sui (SUI) price might reach $5 by 2025.
8. What will be the Sui (SUI) price by 2026?
Sui (SUI) price might reach $8 by 2026.
9. What will be the Sui (SUI) price by 2027?
Sui (SUI) price might reach $11 by 2027.
10. What will be the Sui (SUI) price by 2028?
Sui (SUI) price might reach $13 by 2028.
Top Crypto Predictions
Injective (INJ) Price Prediction
Trust Wallet Token (TWT) Price Prediction
Disclaimer: The opinion expressed in this chart is solely the author’s. It does not represent any investment advice. TheNewsCrypto team encourages all to do their own research before investing.
- SEO Powered Content & PR Distribution. Get Amplified Today.
- PlatoData.Network Vertical Generative Ai. Empower Yourself. Access Here.
- PlatoAiStream. Web3 Intelligence. Knowledge Amplified. Access Here.
- PlatoESG. Carbon, CleanTech, Energy, Environment, Solar, Waste Management. Access Here.
- PlatoHealth. Biotech and Clinical Trials Intelligence. Access Here.
- Source: https://thenewscrypto.com/sui-sui-price-prediction/

