With the 5th US Core CPI (YoY) data releasing at 3.4%, lower than forecast (3.5%) and previous(3.6%), the cryptocurrency market has displayed a strong comeback with the price of Bitcoin recording a jump of approximately 5% post-release.
Following in their footsteps, the altcoins displayed a similar trend by adding significant valuation to their respective portfolios. Positively, the global crypto market capitalization has added 4.82% within the past 5 hours, highlighting a positive sentiment this week.
Kaspa Price Successfully Retests Its Support Level:
Despite recording a correction of approximately 6% over the past week, the KAS crypto has made a strong bullish comeback by adding 9.82% to its portfolio within the past 24 hours.
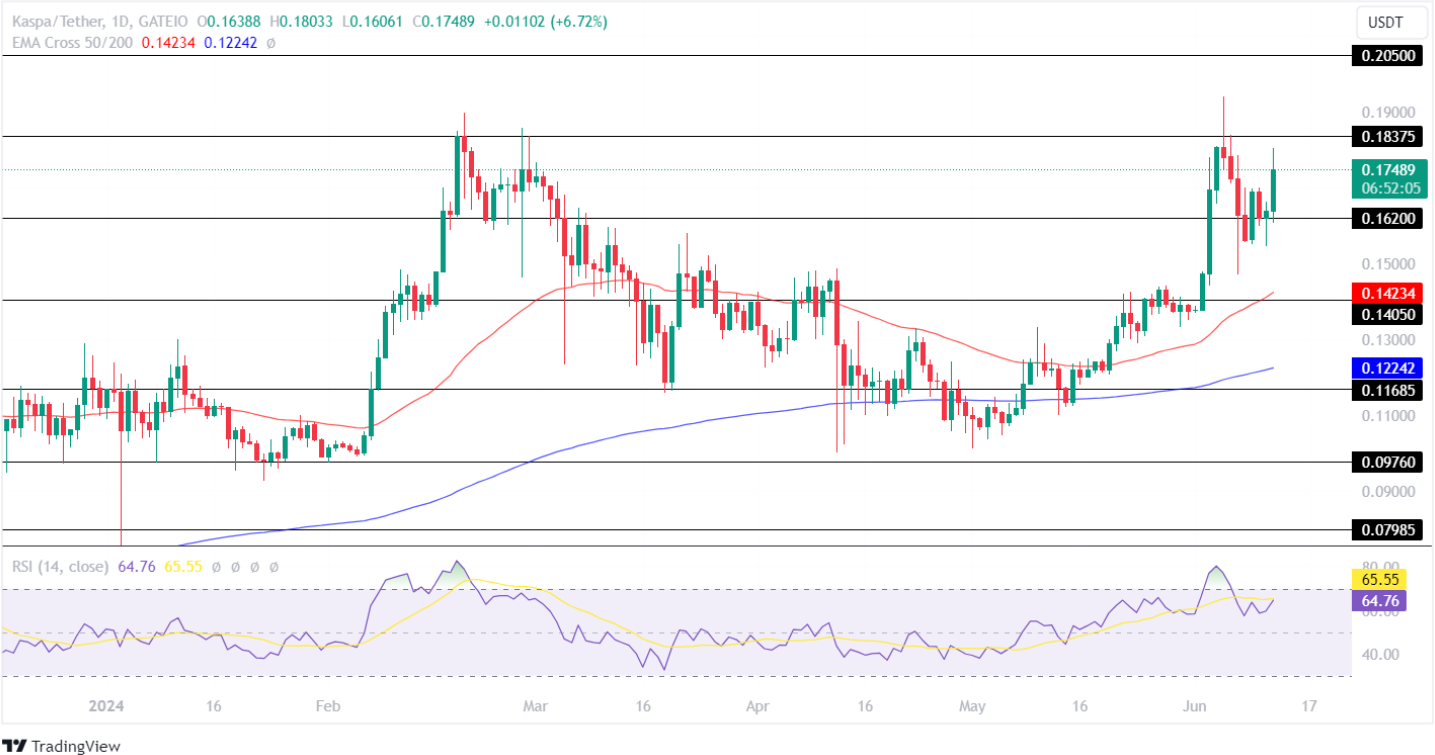
With a trading price of $0.17489, a total supply of 23,904,535,391 KAS tokens, and a market cap of $4.155, the Kaspa (KAS) crypto has successfully claimed the 25th spot in the global crypto market list.
The Relative Strength Index (RSI) displays a positive bounce back in the 1D time frame, suggesting a high possibility of a bullish reversal. Moreover, the averages show a high possibility of a bullish convergence, suggesting the price will continue gaining value in the coming time.
If the market holds the Kaspa price above the support level of $0.1620, the bulls will prepare to retest its important resistance level of $0.18375. Conversely, if the bears overpowered the bulls, the KAS price would break down its support level and test its low of $0.14050 this month.
Stacks (STX) Price Analysis:
The STX price continues to display a bullish price action by adding 14.52% within the past day and 1.70% over the past week. Furthermore, the altcoin has added 20.20% within the past 30 days and has a YTD return of 61.26%, indicating a bullish outlook for the Stacks price in the coming time.
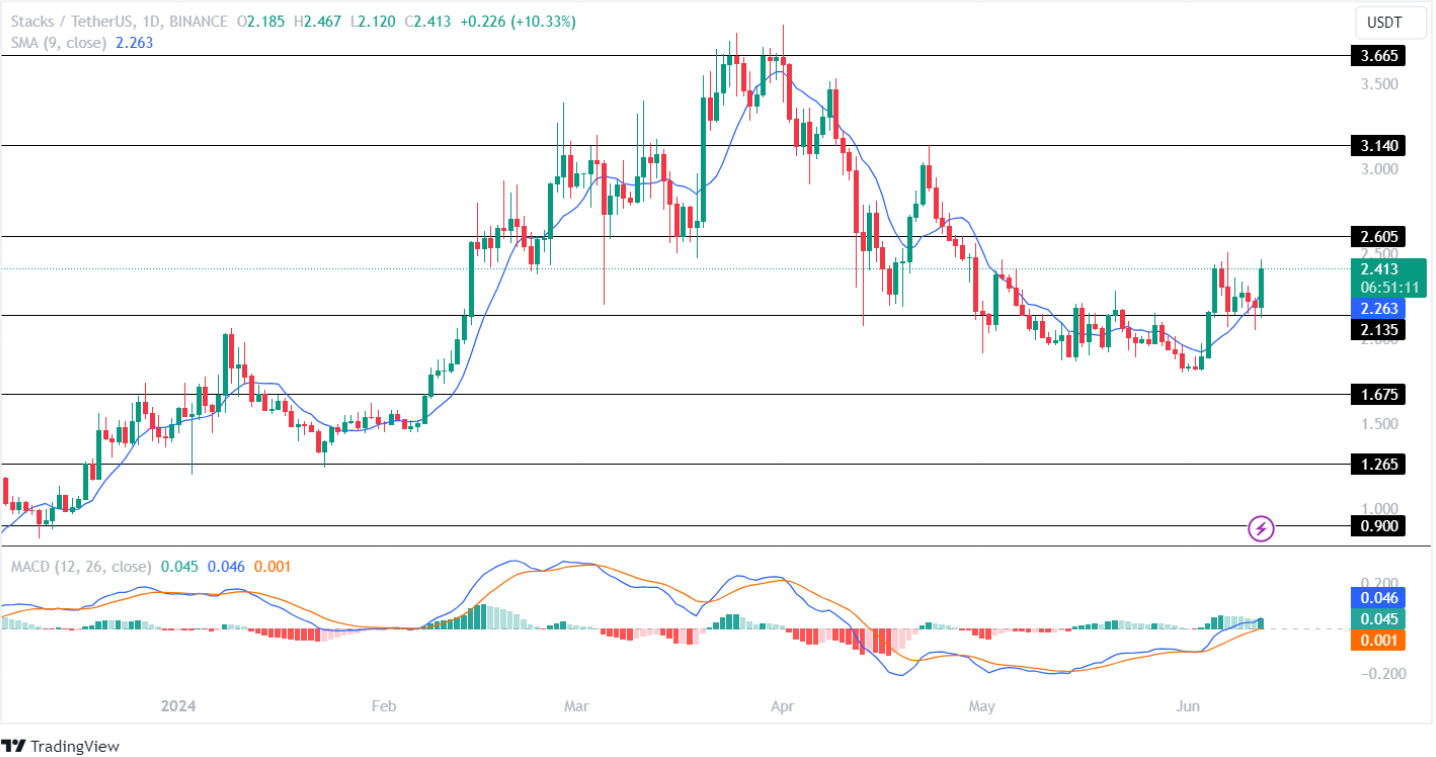
The technical indicator, SMA, displays a positive crossover in the 1D time frame, indicating a rising interest of investors in this altcoin.
The Moving Average Convergence Divergence (MACD) shows a constant rise in the green histogram, indicating increased price action for the altcoin in the crypto market. Furthermore, the averages show a bullish jump in the price chart, suggesting a positive outlook for the STX coin price.
If the bulls regain momentum, the Stacks price will prepare to test its upper resistance level of $3.140 this month. However, in case of a breakdown, the STX crypto will plunge and test its lower support level of $1.675 in the coming time.
- SEO Powered Content & PR Distribution. Get Amplified Today.
- PlatoData.Network Vertical Generative Ai. Empower Yourself. Access Here.
- PlatoAiStream. Web3 Intelligence. Knowledge Amplified. Access Here.
- PlatoESG. Carbon, CleanTech, Energy, Environment, Solar, Waste Management. Access Here.
- PlatoHealth. Biotech and Clinical Trials Intelligence. Access Here.
- Source: https://coinpedia.org/price-analysis/stacks-stx-and-kaspa-kas-record-bullish-reversal-will-they-hold-momentum/

