Over the past few days, Solana has been attempting to reverse its price action. Over the last 24 hours, the altcoin surged above 11%, bringing the price to a crucial level at press time. Losses made over the past week were reversed due to the recent appreciation on the chart.
SOL must remain above the current price for the short-term bullish sentiment to turn into a long-term one. The technical outlook also sided with an upward price movement on the chart.
Although the technicals indicated recovery, the chart still failed to display bulls taking over the market. The demand for the altcoin rose but remained in bearish territory. The buying strength was reduced, and that reflected a fall in accumulation.
If demand remains in the bearish zone over the subsequent trading sessions, SOL might fall into a liquidity pocket again. With Bitcoin trying to climb up on its chart, other altcoins are also attempting to move north.
Solana Price Analysis: One-Day Chart
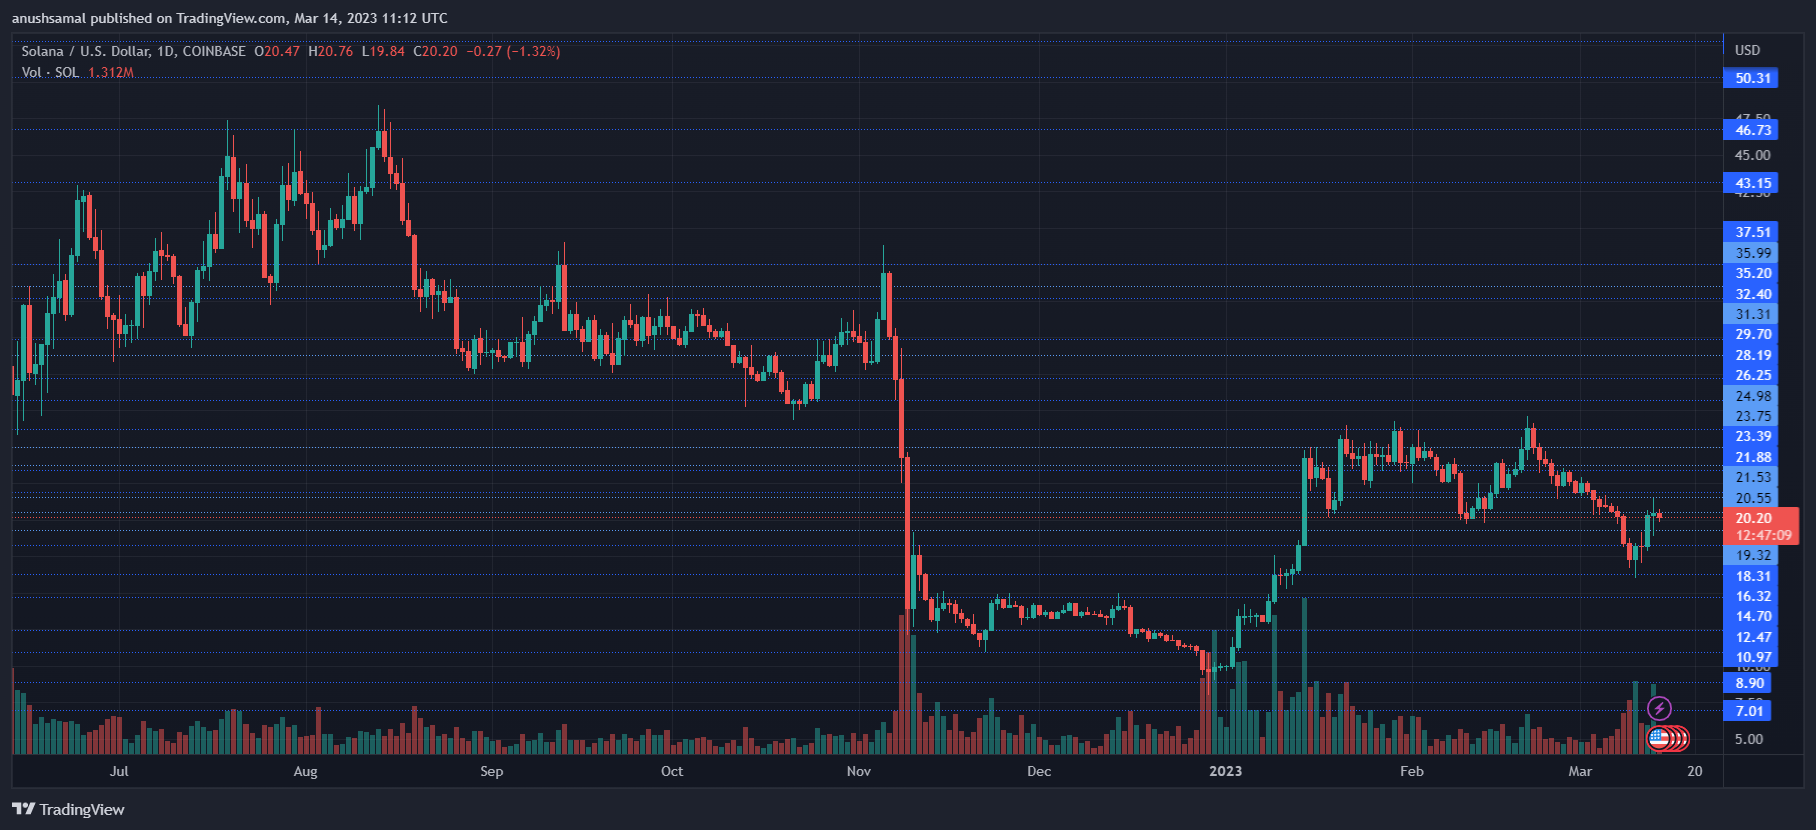
SOL was trading at $20 at press time. The altcoin has managed to retest previous lows on the chart. Overhead resistance for the coin stood at $21. Moving above the $21 level will take the coin to $23. Another vital price ceiling stood at $26. Breaching $26 will take the SOL to $30.
On the other hand, the local support level stood at $18; falling below that would bring the altcoin down to $16. The $20 price area is a confluence of the resistance level for the altcoin.
This price level could cause significant obstruction for the altcoin price. The two levels where traders should sell if the price dips stood at $18 and $16.
Technical Analysis
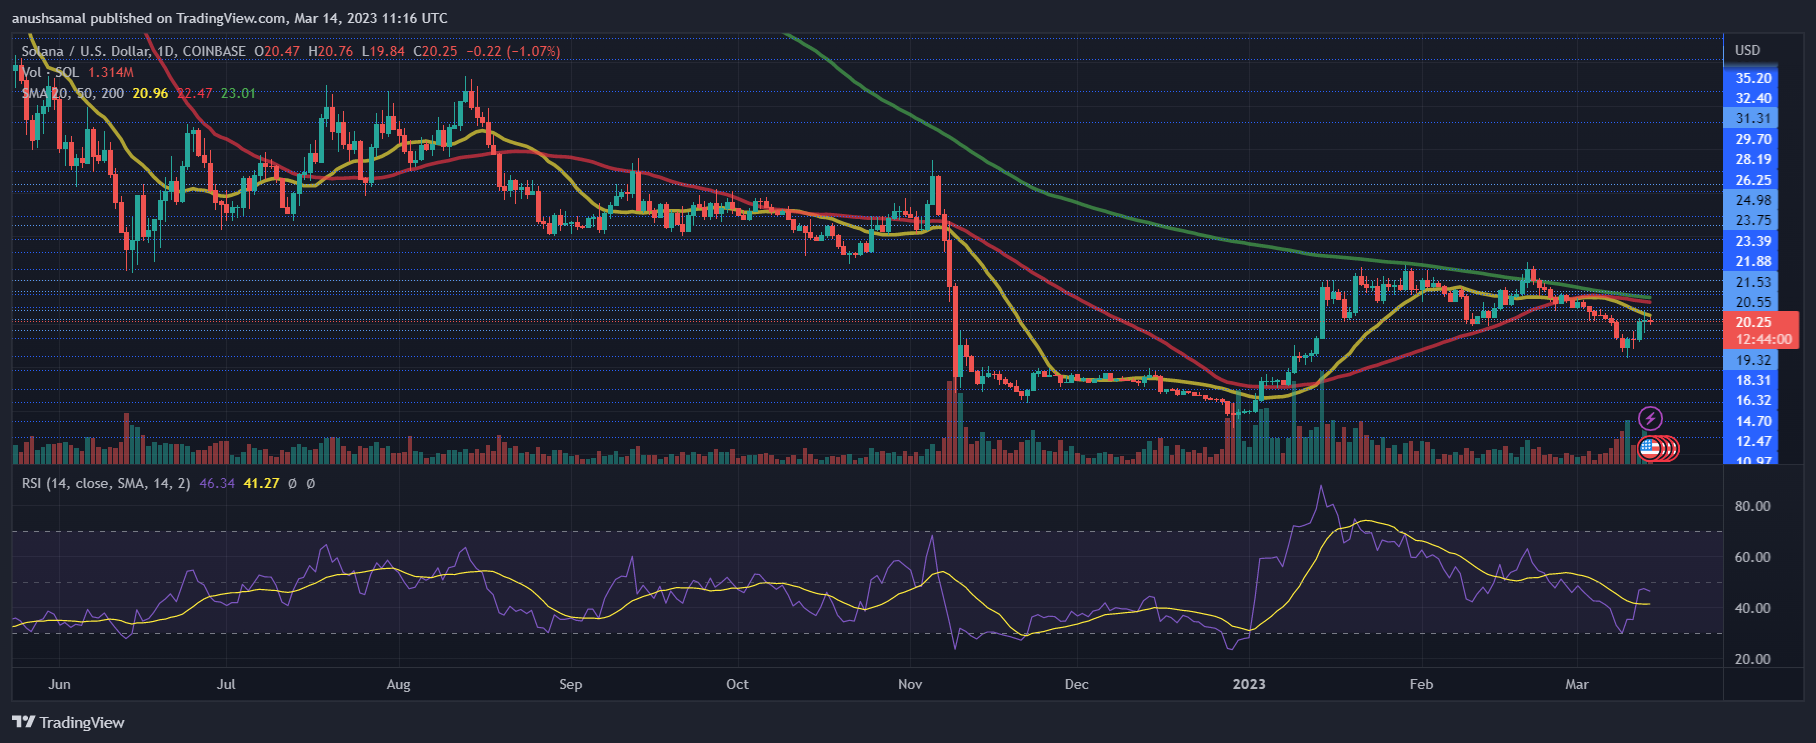
The buying strength of SOL tried to recover, but buyers remained within the bearish territory. Despite an uptick, the Relative Strength Index (RSI) was below the half-line, indicating that selling strength was still greater than buying power.
The price of SOL fell below the 20-Simple Moving Average line, indicating that sellers were still driving the price momentum in the market. With a sustained increase in demand, the RSI could topple over the half-line, strengthening the bulls further.
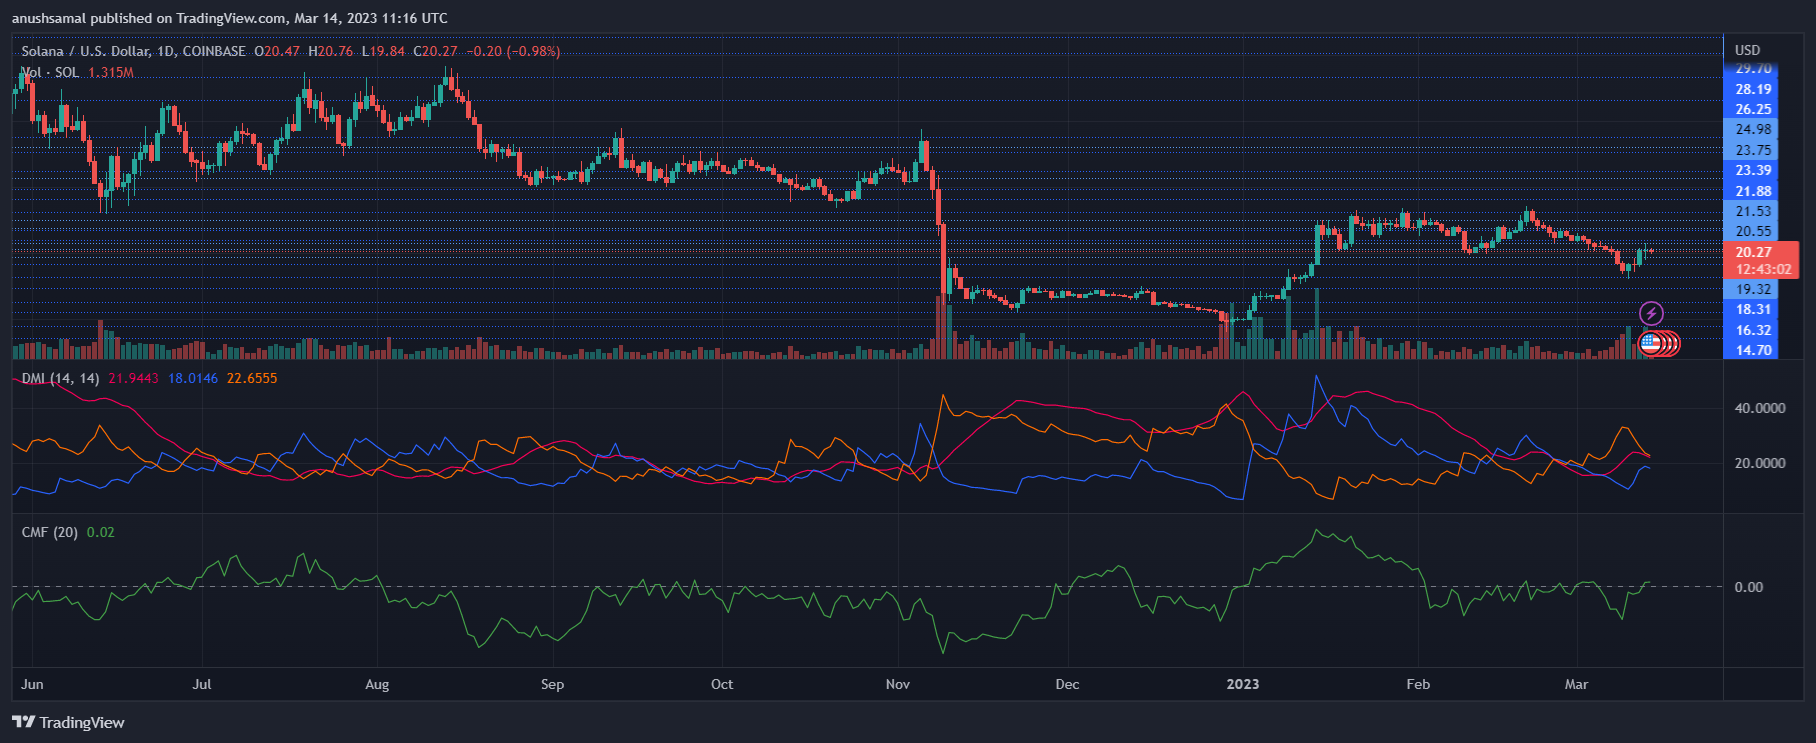
As the altcoin price increased on the daily chart, capital inflows also appreciated over the same time frame. The Chaikin Money Flow rose above the half-line, indicating that capital inflows have increased, reflecting increased demand for the altcoin.
The Directional Movement Index reads the price direction. The indicator was positive, as the +DI line (blue) was above the -DI line (orange).
The Average Directional Index (red) moved above the 20-mark, which suggested that the current price trend was strengthening on the daily chart.
Featured Image From UnSplash, Charts From TradingView.com
- SEO Powered Content & PR Distribution. Get Amplified Today.
- Platoblockchain. Web3 Metaverse Intelligence. Knowledge Amplified. Access Here.
- Source: https://www.newsbtc.com/news/solana/solana-beneath-crucial-resistance-traders-should-book-profits-at-these-levels/

