Join Our Telegram channel to stay up to date on breaking news coverage
The Render Token price prediction shows that RNDR may head toward the upper boundary of the channel to continue the upward trend.
Render Token Prediction Statistics Data:
- Render Token price now – $4.31
- Render Token market cap – $1.6 billion
- Render Token circulating supply – 376.1 million
- Render Token total supply – 531 million
- Render Token Coinmarketcap ranking – #47
RNDR/USD Market
Key Levels:
Resistance levels: $5.50, $6.00, $6.50
Support levels: $3.00, $2.50, $2.00
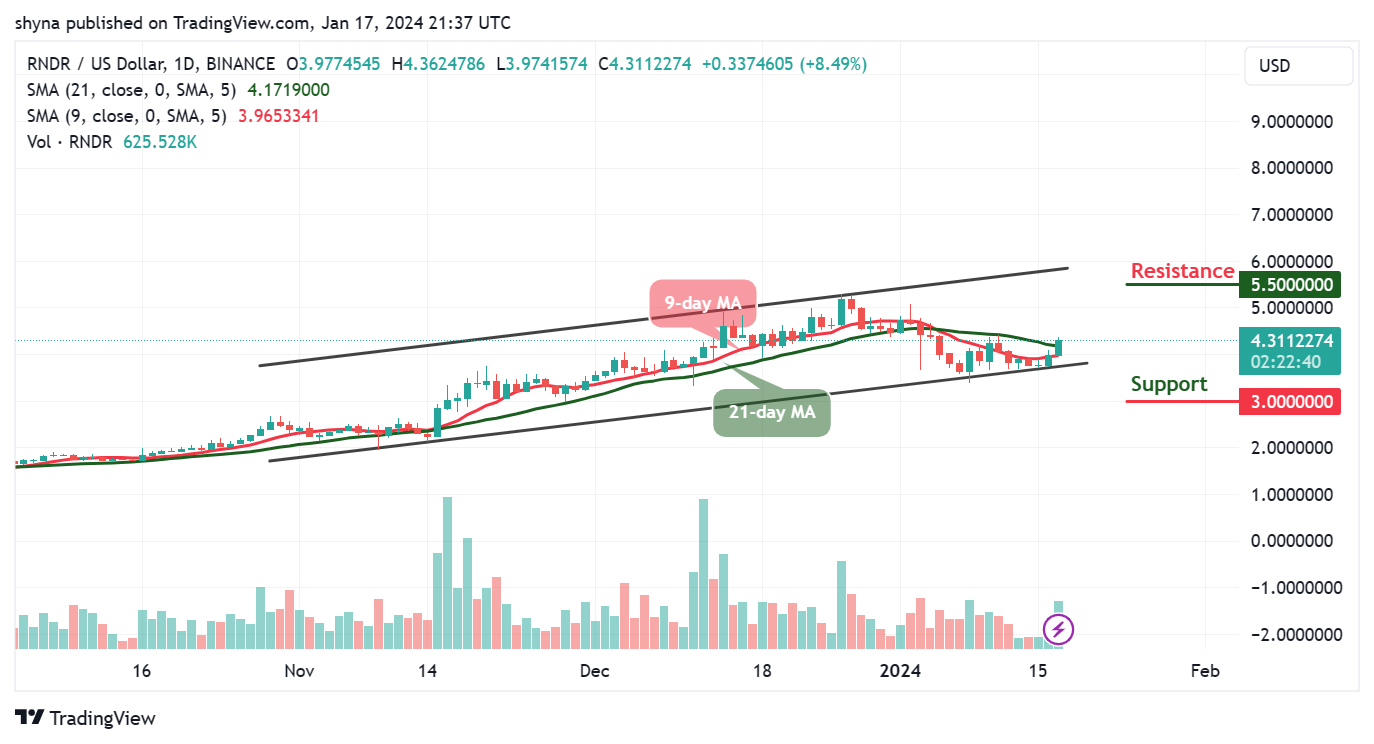
RNDR/USD is currently changing hands at around $4.31 as the coin touches the daily high at $4.34 with a market cap of $1.6 billion. Today’s trading begins with a slight uptrend in the market as the coin moves to cross above the 9-day and 21-day moving averages. However, traders are anticipating that the current price movement is an indication of the upcoming price rally in the market.
Render Token Price Prediction: RNDR May Head to the Upside
Looking at the daily chart, the next step for the Render Token price is to hit the potential resistance level of $4.50. Once this is done, bulls may now push the coin to hit the nearest resistance level of $5.00 before locating the resistance levels at $5.50, $6.00, and $6.50 respectively.
However, as the 9-day moving average moves to cross above the 21-day moving average, RNDR/USD may continue to move to the north, once this plays out, it can manage to sustain the bullish movement above the upper boundary of the channel. Meanwhile, if the price decides to make a quick turn to the south, the support levels could be found at $3.00, $2.50, and$2.00 if slide below the lower boundary of the channel.
RNDR/BTC Soars to the Upside
Against Bitcoin, the Render Token is hovering above the 9-day and 21-day moving averages. At the moment, bulls may continue to push the coin to the positive side as the 9-day moving average moves to cross above the 21-day moving average.

However, if the bulls push and keep the price toward the upper boundary of the channel, RNDR/BTC could rise to the resistance level of 1250 SAT and above. On the contrary, any bearish movement below the lower boundary of the channel could bring the price toward the support level of 770 SAT and below.
Render Token Alternatives
The Render Token price could spike to the upside as the coin heads toward the upper boundary of the channel. However, if the market continues with the upward movement, the $5.0 resistance level is likely to surface. Therefore, RNDR/USD may further look for higher price levels if the bulls increase the pressure.
Meanwhile, the Render Token currently holds the 47th position on CoinMarketCap with a $1.6 billion market cap, the Bitcoin Minetrix (BTCMTX) token distinguishes itself with a pioneering approach to meme creation, integrating advanced AI technology and a token-centric credit system. The BTCMTX presale has achieved a noteworthy milestone by raising close to $8.8 million, presenting a compelling investment prospect given its revolutionary features.
New Crypto Mining Platform – Bitcoin Minetrix

- Audited By Coinsult
- Decentralized, Secure Cloud Mining
- Earn Free Bitcoin Daily
- Native Token On Presale Now – BTCMTX
- Staking Rewards – Over 100% APY
Join Our Telegram channel to stay up to date on breaking news coverage
- SEO Powered Content & PR Distribution. Get Amplified Today.
- PlatoData.Network Vertical Generative Ai. Empower Yourself. Access Here.
- PlatoAiStream. Web3 Intelligence. Knowledge Amplified. Access Here.
- PlatoESG. Carbon, CleanTech, Energy, Environment, Solar, Waste Management. Access Here.
- PlatoHealth. Biotech and Clinical Trials Intelligence. Access Here.
- Source: https://insidebitcoins.com/news/render-token-price-prediction-for-today-january-18-rndr-technical-analysis

