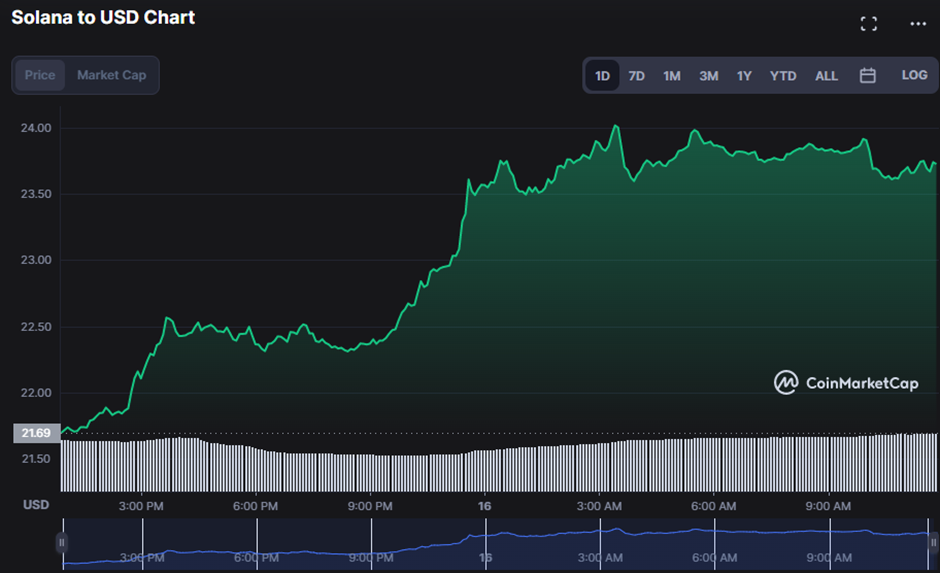
- SOL’s price fluctuates from $21.70 to $24.03 in 24 hours under bullish control.
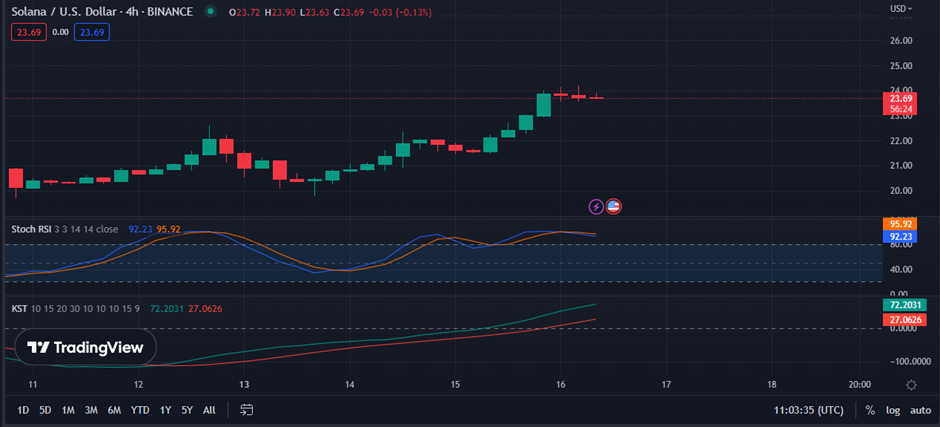
- Stochastic RSI warns traders the market is overbought.
- If the bullish force continues, the SOL market’s $24.03 barrier may not hold.
Solana (SOL) began trading at $21.70, and since then, bulls have been in control, propelling the price to an intra-day high of $24.03. The price managed to hold these gains, and as of press time, it had risen by 9.79% to $23.83. This price increase for SOL is a bright light in the crypto sector, with investors exhibiting confidence and bullishness toward SOL.
During the upturn, the market capitalization and 24-hour trading volume increased by 9.83% and 13.92%, respectively, to $8,972,355,923 and $904,027,348. As a consequence, SOL tokens are in high demand, with more investors eager to invest in the token and enjoy the rewards of its growth. This surge is a good indicator of SOL’s future since it demonstrates that investors trust the token’s long-term potential and growth possibilities.
Questioning the bullish momentum in SOL, the Fisher Transform trends below its signal line at 3.75, and a potential trend reversal is on the horizon. As the Fisher Transform drops below the signal line, SOL may be entering a bearish market, which might lead to a price drop. However, if bulls keep up the pressure and the Fisher Transform crosses back above the signal line, SOL’s positive trend may continue, and the value may rise even more.
The Klinger Oscillator has crossed below its signal line and is heading south, indicating that the current bullish trend in SOL may be about to reverse. This shift suggests that bulls have likely exhausted their purchasing strength and that a decline in SOL’s value is conceivable shortly; but, because it has not yet passed below, the bullish trend of SOL may be able to rebound and continue its increase in value.
Since the Money Flow Index (MFI) is now at 78.05 and falling, a trend reversal may occur shortly if the Klinger Oscillator drops below its signal line. Based on the MFI reading, the bulls are still in charge of the market, but they may soon hit their purchasing power peak, allowing the bears to profit from the waning demand for SOL.

Furthermore, the stochastic RSI falls below its signal line with a reading of 92.94, signaling a possible conclusion to the upward trend. While the stochastic RSI is still considerably above its overbought level, this reversal suggests that the bullish trend may end. If the reverse holds, it might be the first indication of a shift in market direction.
With a value of 72.2863, the Know Sure Thing (KSI) indicator points north and goes over its signal line, indicating that the trend is continuing bullish. This reading implies that, although a reversal is conceivable, the markets remain solidly in a positive direction and will continue to rise.
If a bullish force is to stay in the SOL market, bulls must turn resistance into support in the coming hours.
Disclaimer: The views and opinions, as well as all the information shared in this price analysis, are published in good faith. Readers must do their own research and due diligence. Any action taken by the reader is strictly at their own risk, Coin Edition and its affiliates will not be held liable for any direct or indirect damage or loss.
Post Views: 12
- SEO Powered Content & PR Distribution. Get Amplified Today.
- Platoblockchain. Web3 Metaverse Intelligence. Knowledge Amplified. Access Here.
- Source: https://coinedition.com/positive-sentiment-dominates-sol-market-bulls-in-drivers-seat/

