Join Our Telegram channel to stay up to date on breaking news coverage
The Maker price prediction sees a 2.71% price increase over the past 24 hours of trading as the cryptocurrency touches the $931.7 Level.
Maker Prediction Statistics Data:
- Maker price now – $915.2
- Maker market cap – $897.6 million
- Maker circulating supply – 977.6 thousand
- Maker total supply – 977.6 thousand
- Maker Coinmarketcap ranking – #46
MKR/USD Market
Key Levels:
Resistance levels: $1100, $1200, $1300
Support levels: $700, $600, $500
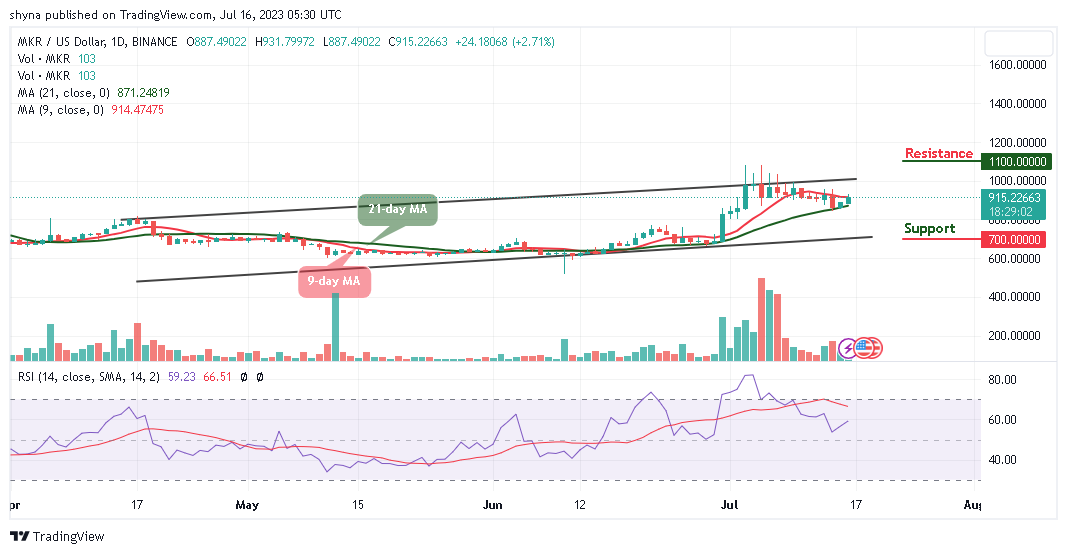
MKR/USD gains a 2.71% price rise over the past 24 hours of trading as the cryptocurrency bounces from the $887.49 to $931.79 resistance level. The Maker may face the upside as the red line of the 9-day MA remains above the green line of the 21-day MA. At the time of writing, the movement is shifting back into the bullish favor, with the technical indicator Relative Strength Index (14) moving to cross above the 60-level.
Maker Price Prediction: Maker (MKR) Ready for a Spike above $1k Level
The Maker price may need to rise above $1000 if the buyers keep the price above the 9-day and 21-day moving averages. On the contrary, traders may consider the market as bearish if the sellers take the market movement to the lower side.
However, toward the upside, the first level of resistance lies at $950, while the potential resistance levels lie at $1100, $1200, and $1300. Moreover, if the sellers bring the price toward the lower boundary of the channel, traders may expect supports to be located at $700, 600, and $500 while the technical indicator Relative Strength Index (14) faces the north to give more bullish signals.
When compares with Bitcoin, the Maker price is trading within the 9-day and 21-day moving averages as the coin moves to cross above the 9-day moving average. From the above, the nearest resistance level is likely to touch 3400 SAT if the bulls increase the buying pressure. Above this, higher resistance could be located at 3600 SAT and above.

On the other hand, if the selling pressure creates a fresh low and crosses below the moving averages, lower support may be found at 2400 SAT and below. Meanwhile, the technical indicator Relative Strength Index (14) is moving to cross above the 60-level, which shows that the market may be preparing for an uptrend.
Maker Alternatives
According to the daily chart, if the Maker price crosses above the 9-day and 21-day moving averages, it is likely to break above the upper boundary of the channel. On that note, the daily chart reveals that if the 9-day moving average remains above the 21-day moving average, it will confirm the presence of the bulls in the market.
However, given the presale’s impressive fundraising, it’s clear that Wall Street Memes has leveraged the meme coin frenzy, but the team isn’t stopping there. Meanwhile, this new meme token has now raised nearly $16 million via its ongoing presale phase, which indicates growing investor interest.
Wall Street Memes – Next Big Crypto

- Early Access Presale Live Now
- Established Community of Stocks & Crypto Traders
- Featured on BeInCrypto, Bitcoinist, Yahoo Finance
- Rated Best Crypto to Buy Now In Meme Coin Sector
- Team Behind OpenSea NFT Collection – Wall St Bulls
- Tweets Replied to by Elon Musk
Join Our Telegram channel to stay up to date on breaking news coverage
- SEO Powered Content & PR Distribution. Get Amplified Today.
- PlatoData.Network Vertical Generative Ai. Empower Yourself. Access Here.
- PlatoAiStream. Web3 Intelligence. Knowledge Amplified. Access Here.
- PlatoESG. Automotive / EVs, Carbon, CleanTech, Energy, Environment, Solar, Waste Management. Access Here.
- BlockOffsets. Modernizing Environmental Offset Ownership. Access Here.
- Source: https://insidebitcoins.com/news/maker-price-prediction-for-today-july-16-mkr-usd-rebounds-as-the-price-faces-1000-resistance

