<!–
–>
Published 2 hours ago
Over the past four months, a downsloping trendline has been constantly hammering the LUNC price with dynamic resistance. The daily chart shows three rejections from this trendline indicating the traders are actively selling at this level. Though the growing supply pressure tries to maintain an established downtrend, the buyers heavily protect horizontal support of $0.000079. The falling trendline and flat support resemble the formation of a bearish continuation pattern called a descending triangle. Here’s how this pattern could influence the future price of Terra classic coins.
advertisement
Also Read: Terra Luna Classic L1TF Announces Partnership For Station And Finder Development
LUNC Price Daily Chart
- A potential reversal from $0.000079 sets the LUNC price for a 10% jump.
- The market participants witnessed demand pressure at the $0.000079 mark
- The intraday trading volume in the LUNC coin is $22.4 Million, indicating a 12% gain.
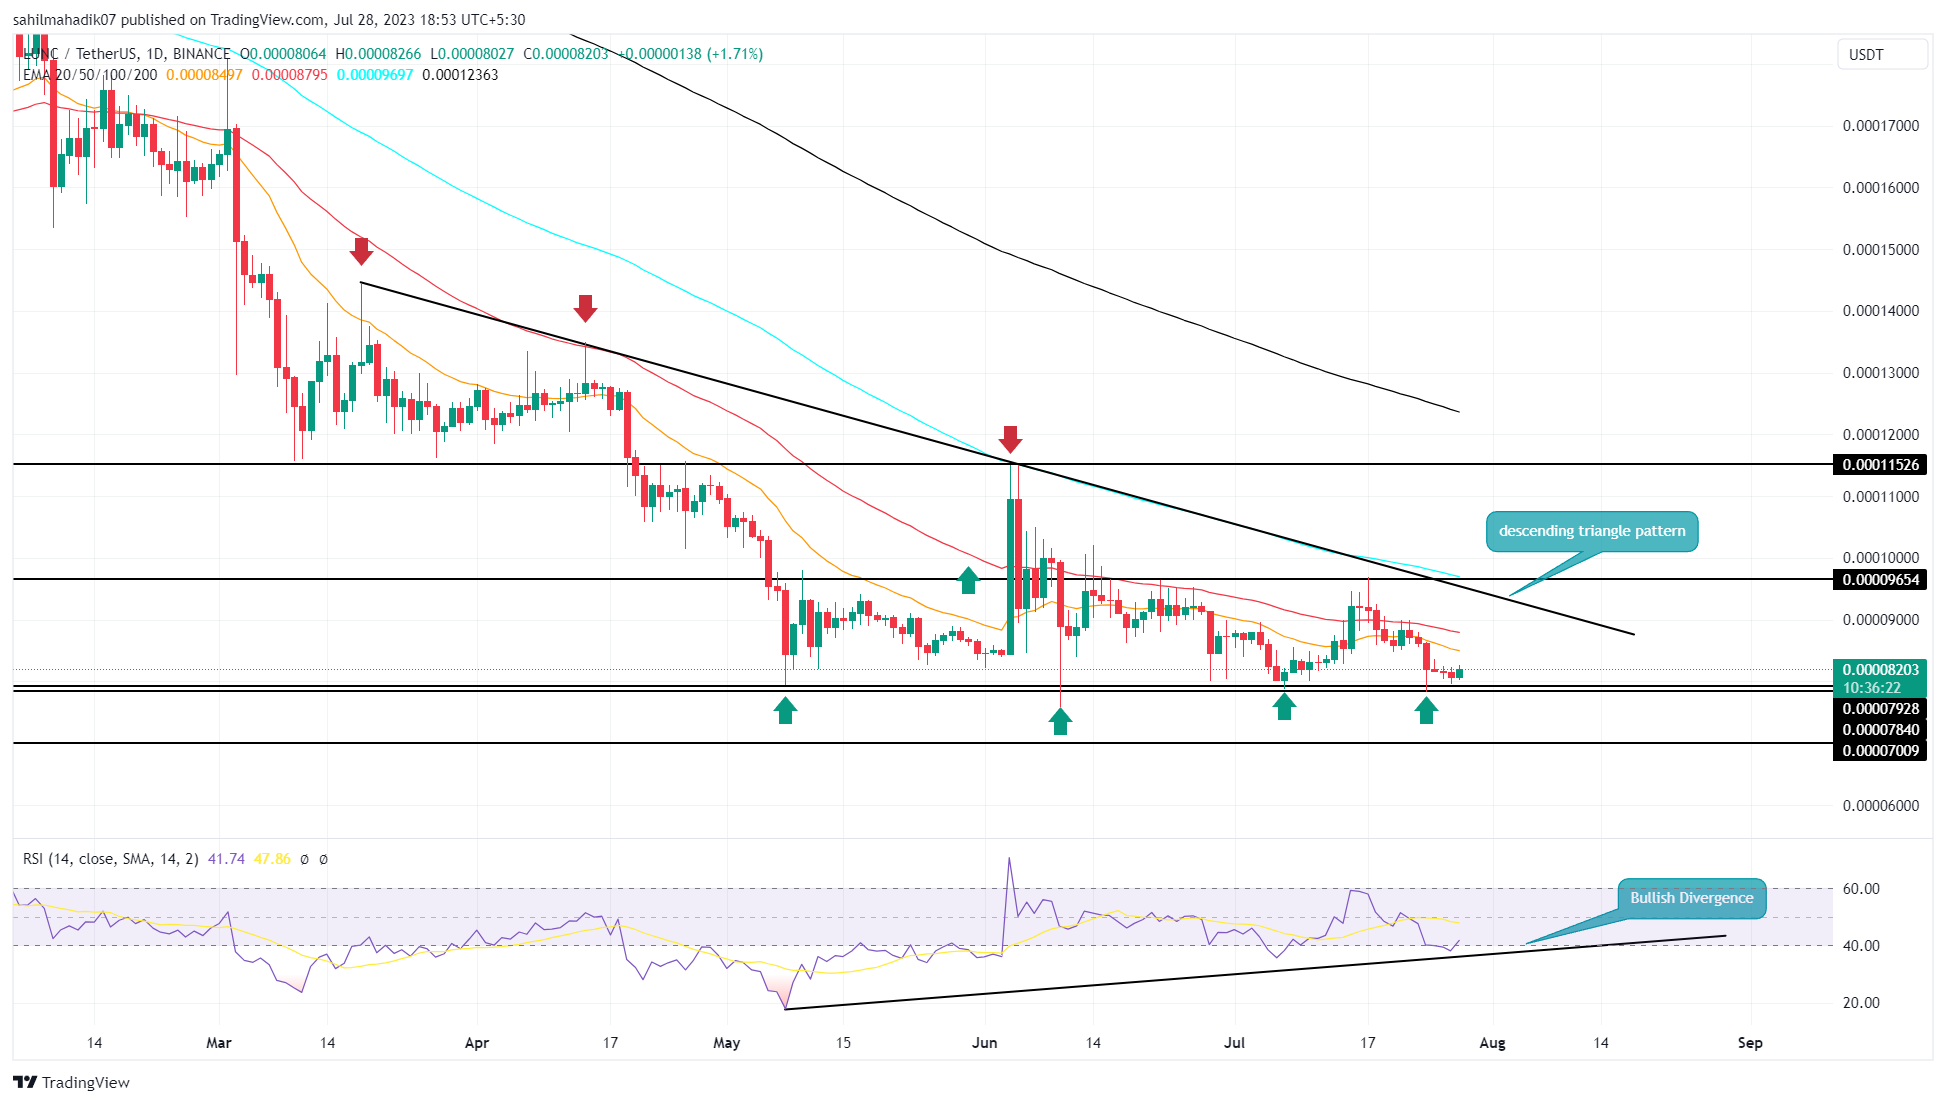
Source- Tradingview
With the increased bearishness in the crypto market. the LUNC price has been in a correction phase for the past two weeks. From the $0.0000968 high the coin price tumbled 15% to reach the current trading price of $0.0000822.
With an intraday gain of 1.92%, the coin price hovers above the bottom support of $0.000079. The coin price rebounded several times from this support indicating a strong accumulation zone for investors.
Therefore until this support is intact, the LUNC price may continue to resonate in a sideways trend. The potential reversal could surge the prices by 10% and rechallenges the overhead trendline near $0.00009.
Will Terra Classic Price Correction Reach $0.00007?
In theory, the descending triangle pattern is known as the downtrend continuation pattern which intensifies the market selling pressure upon the breakdown of its $0.000079 neckline. Therefore, a breakdown below $0.000079 will offer buyers an additional barrier to pressure the coin price to a lower level. The post-breakdown fall could plummet the price back to the $0.00007 mark.
Share this article on:
advertisement
The presented content may include the personal opinion of the author and is subject to market condition. Do your market research before investing in cryptocurrencies. The author or the publication does not hold any responsibility for your personal financial loss.
<!– Close Story–>
- SEO Powered Content & PR Distribution. Get Amplified Today.
- PlatoData.Network Vertical Generative Ai. Empower Yourself. Access Here.
- PlatoAiStream. Web3 Intelligence. Knowledge Amplified. Access Here.
- PlatoESG. Automotive / EVs, Carbon, CleanTech, Energy, Environment, Solar, Waste Management. Access Here.
- BlockOffsets. Modernizing Environmental Offset Ownership. Access Here.
- Source: https://coingape.com/markets/lunc-price-to-hit-0-00009-indicator-signals-reversal-at-support/

