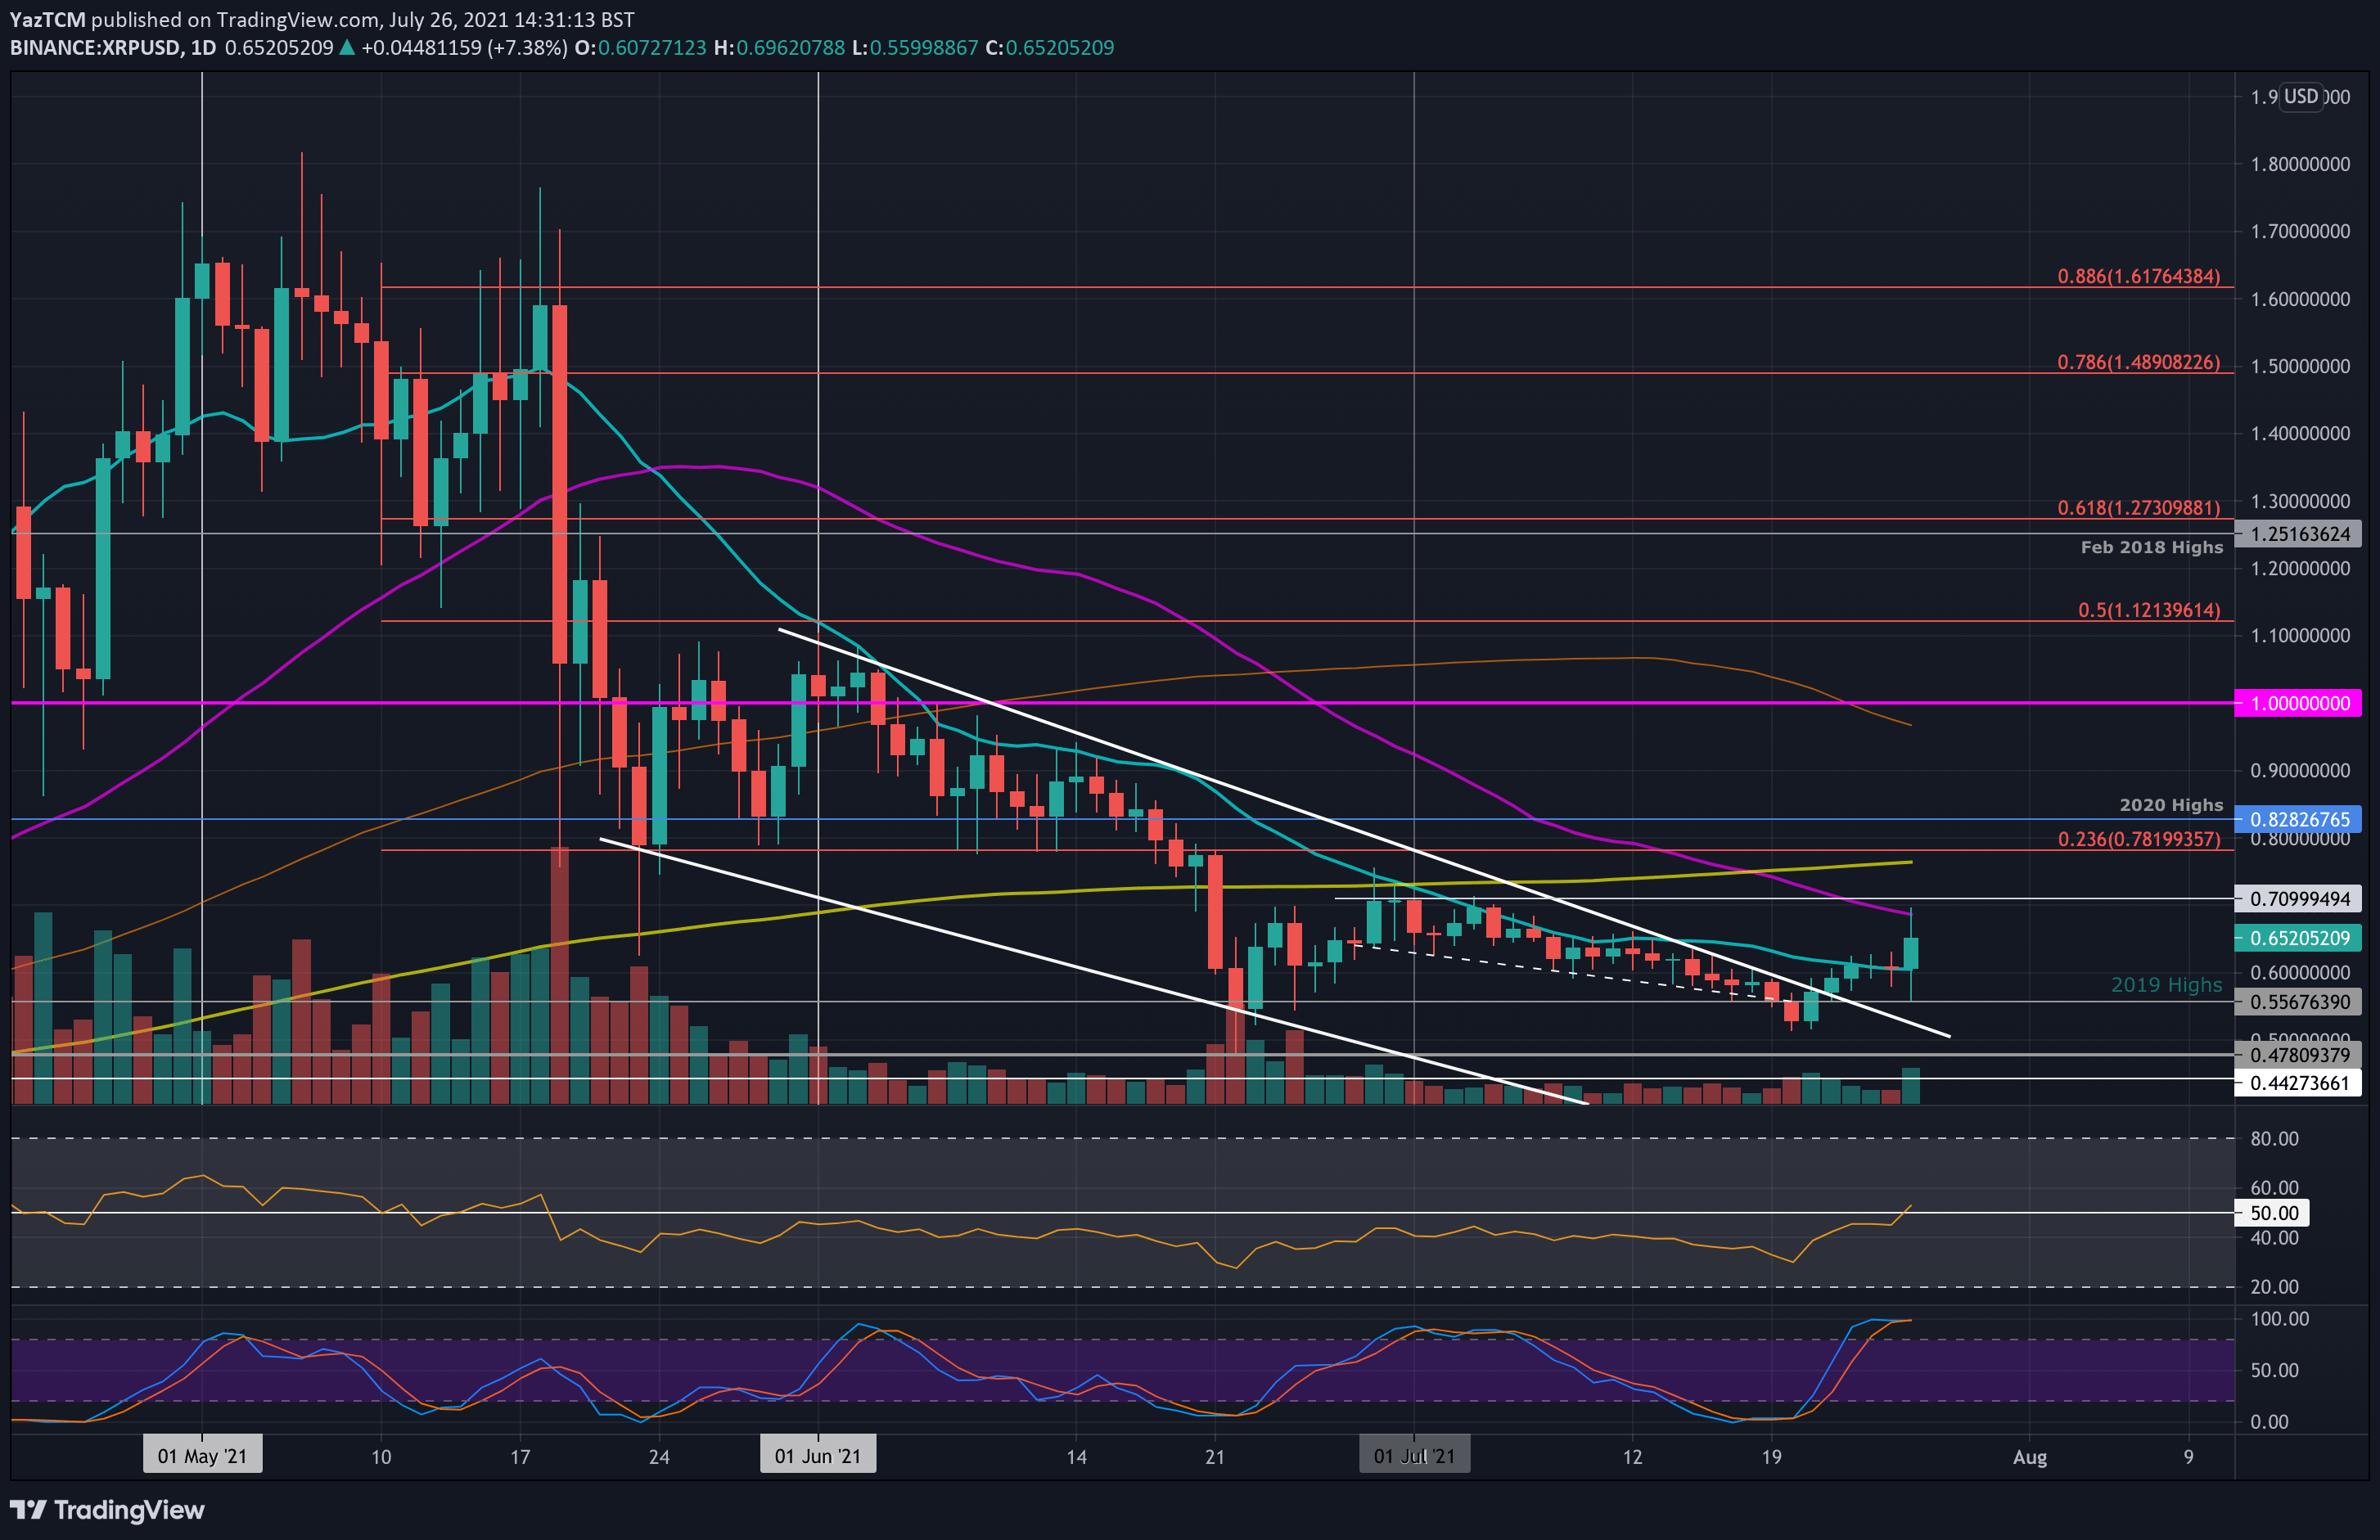
XRP/USD – XRP Hits 50-day MA.
Key Support Levels: $0.6, $0.556, $0.5.
Key Resistance Levels: $0.69, $0.71, $0.77.
XRP was trading inside a descending price channel since the start of June. However, the coin finally managed to break toward the upside last Thursday and hit the 20-day MA around $0.6 on Friday.
Over the weekend, XRP battled with the 20-day MA but could not overcome it until today, when XRP surged 10%. The coin reached as high as $0.696 but found resistance at the 50-day MA and has since rolled over to $0.65.
XRP-USD Short Term Price Prediction
Looking ahead, the first resistance lies at the 50-day MA at around $0.69. This is followed by $0.71 (July resistance), $0.77 (200-day MA), and $0.8282 (2020 Highs).
On the other side, the first support lies at $0.6. This is followed by $0.556 (2019 highs), $0.5, and $0.478.
The RSI is now finally above the midline for the first time since the 20th of May. This suggests that the bullish momentum is starting to gather momentum.
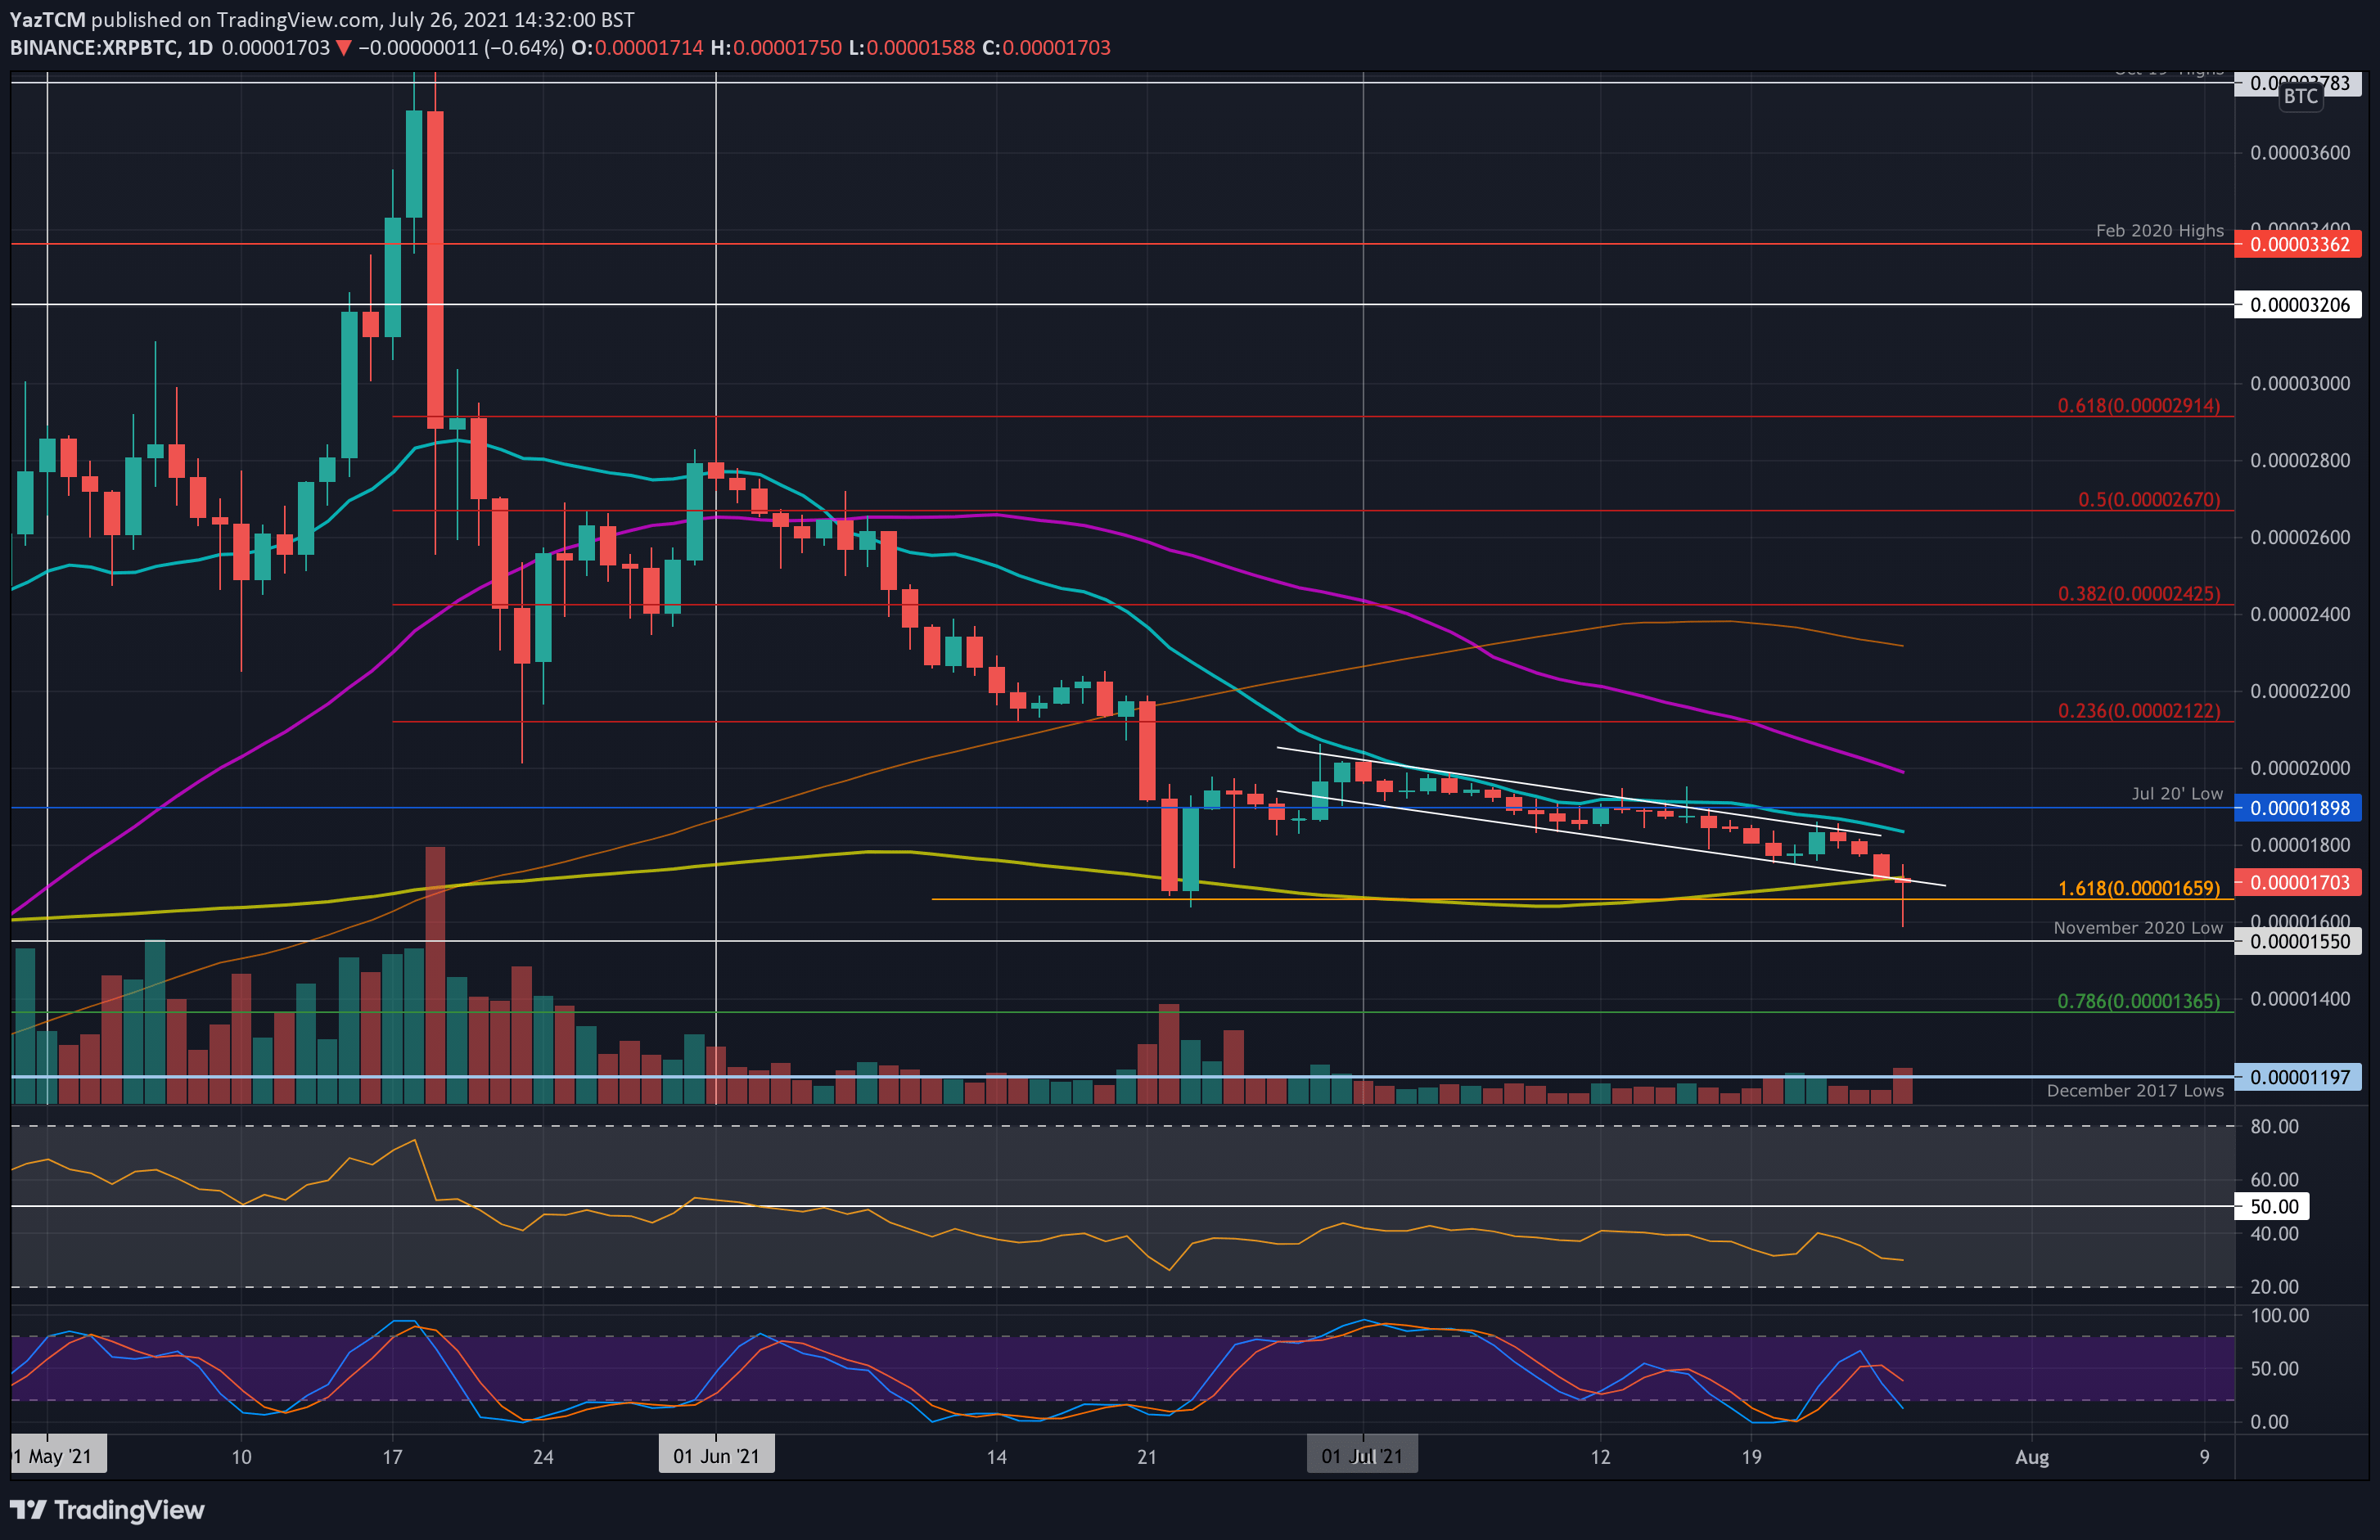
XRP/BTC – Bears Push Beneath Descending Price Channel
Key Support Levels: 1660 SAT, 1550 SAT, 1365 SAT.
Key Resistance Levels: 1800 SAT, 1900 SAT, 2000 SAT.
Against BTC, XRP fell beneath the descending price channel it was trading within. The coin fell from the upper boundary last week to reach the lower boundary yesterday. Today’s price drop caused XRP to break below the 200-day MA as well as the price channel.
It dropped as low as 1600 SAT but has since bounced higher and is trading around 1700 SAT, just beneath the 200-day MA.
XRP-BTC Short Term Price Prediction
Looking ahead, the first support lies at 1660 SAT (downside 1.618 Fib Extension). This is followed by 1550 SAT, 1365 SAT (.786 Fib), and 1200 SAT (December 2017 lows).
On the other side, the first resistance lies around 1800 SAT (20-day MA & price channel upper boundary). Above this, resistance lies at 1900 SAT (Jul 20 low), 2000 SAT (50-day MA), and 2120 SAT (bearish .236 Fib).
The RSI is well beneath the midline, indicating that the bearish momentum is increasing.
Binance Futures 50 USDT FREE Voucher: Use this link to register & get 10% off fees and 50 USDT when trading 500 USDT (limited offer).
PrimeXBT Special Offer: Use this link to register & enter POTATO50 code to get 50% free bonus on any deposit up to 1 BTC.
Disclaimer: Information found on CryptoPotato is those of writers quoted. It does not represent the opinions of CryptoPotato on whether to buy, sell, or hold any investments. You are advised to conduct your own research before making any investment decisions. Use provided information at your own risk. See Disclaimer for more information.
Cryptocurrency charts by TradingView.
PlatoAi. Web3 Reimagined. Data Intelligence Amplified.
PlatoAi. Web3 Reimagined. Data Intelligence Amplified.
Click here to access.

