- The US CPI and Core CPI brought high action.
- A valid breakout through the downtrend line brings new longs.
- Invalidating its breakout should signal a new sell-off.
The gold price edged higher before and after the US economic data. The metal has marked the daily high at $1,930. However, gold has retreated a little and is trading at $1,924, at the time of writing.
-Are you looking for the best CFD broker? Check our detailed guide-
As pointed in our previous analysis, XAU/USD was expected to register sharp movements around the United States inflation figures.
The Consumer Price Index reported a 0.2% growth in July, matching expectations, while Core CPI increased by 0.2% as predicted.
Furthermore, the CPI y/y reported only a 3.2% growth compared to the 3.3% growth forecasted, but above 3.0% growth in the previous reporting period, while Unemployment Claims jumped to 248K in the previous week from 227K, far above 231K expected.
The XAU/USD rallied as the Federal Reserve could refrain from raising rates in the next meeting. Only higher inflation could send the gold price lower.
Tomorrow, the fundamentals remain in the driving seat. The UK GDP is expected to report a 0.2% growth versus a 0.1% drop in the previous reporting period.
Furthermore, the UK is to release the Industrial Production, Manufacturing Production, Goods Trade Balance, Prelim GDP, and Index of Services data as well.
Still, only the US PPI, Core PPI, and Prelim UoM Consumer Sentiment could be decisive and could change the sentiment.
Gold Price Technical Analysis: Falling Wedge
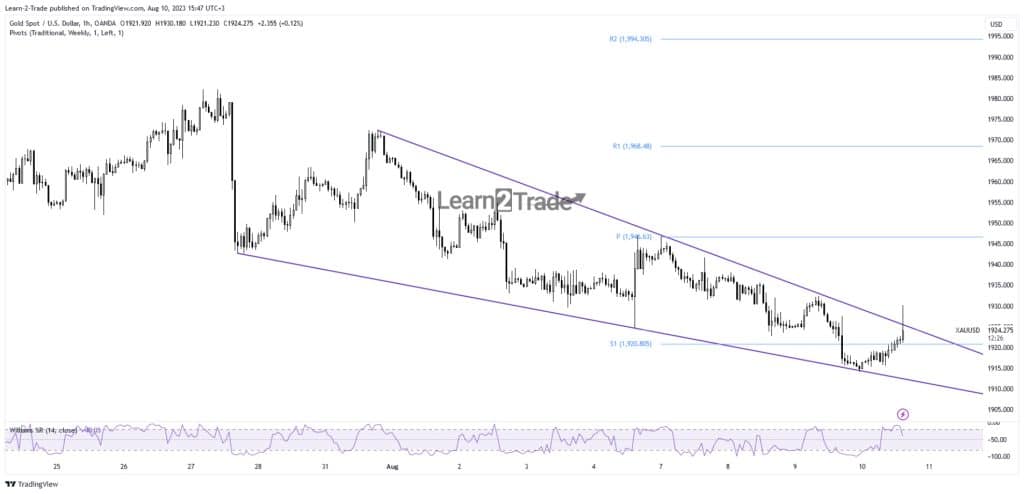
Technically, the price action developed a Falling Wedge pattern which may represent a bullish formation. It has failed to stay below the $1,920 and now it challenges the downtrend line.
-If you are interested in guaranteed stop-loss forex brokers, check our detailed guide-
A valid breakout above this dynamic resistance should announce further growth. On the contrary, false breakouts through this line signals a new sell-off.
Activating the chart pattern should bring us new long opportunities as the XAU/USD could develop a new leg higher.
Looking to trade forex now? Invest at eToro!
68% of retail investor accounts lose money when trading CFDs with this provider. You should consider whether you can afford to take the high risk of losing your money
- SEO Powered Content & PR Distribution. Get Amplified Today.
- PlatoData.Network Vertical Generative Ai. Empower Yourself. Access Here.
- PlatoAiStream. Web3 Intelligence. Knowledge Amplified. Access Here.
- PlatoESG. Automotive / EVs, Carbon, CleanTech, Energy, Environment, Solar, Waste Management. Access Here.
- PlatoHealth. Biotech and Clinical Trials Intelligence. Access Here.
- ChartPrime. Elevate your Trading Game with ChartPrime. Access Here.
- BlockOffsets. Modernizing Environmental Offset Ownership. Access Here.
- Source: https://www.forexcrunch.com/gold-price-hits-1930-after-us-inflation-missed-expectation/

