Ethereum (ETH), the second-largest cryptocurrency by market capitalization, has recently seen its price fall below the 4-hour Simple Moving Average (SMA). This technical development is noteworthy for traders and investors, as the 4-hour SMA is often used to gauge short-term market momentum.
When a cryptocurrency’s price drops below this moving average, it can signal a potential shift in market sentiment from bullish to bearish. This could imply increased selling pressure and a possible downward trend continuation. The implications of this price movement extend beyond technical analysis, as broader market conditions, investor behavior, and fundamental factors also play a crucial role in shaping Ethereum’s future trajectory.
In this article, we will be exploring ETH’s potential price action with the help of technical indicators.
Ethereum Price Condition On The 4-Hour Chart
Firstly, it can be observed that ETH’s price in the 4-hour timeframe has experienced a drop below the 100-day SMA after moving in a consolidation manner for a while. It should be noted that most times when an asset drops below SMA, it could indicate a short or long-term move in that direction.
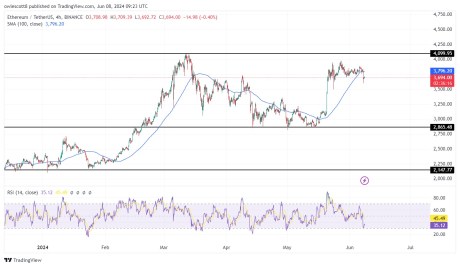
Additionally, the Relative Strength Index (RSI) indicator also confirms that Ethereum might move in the downward direction for a while as the RSI line has crossed below 50% and could trend there for a while.
From the daily chart, it can be noticed that Ethereum is attempting to make a move toward the 100-day SMA after dropping a bearish candlestick on the previous day. At this point, it can be suggested ETH dropped to test the 100-day SMA before making an upward move again.
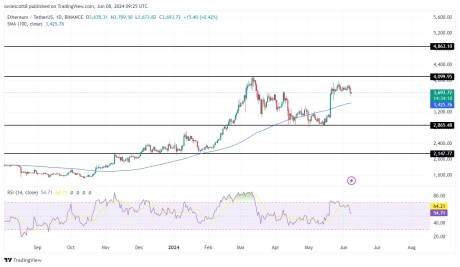
Finally, the RSI line from the RSI indication is currently dropping out of the overbought zone toward 50% indicating that there is still room for ETH to move downward.
ETH Price Projection
As of right now, Ethereum is attempting to move downward toward the daily SMA, If it drops below, it will continue to move downward toward the $2,865 support level. Furthermore, it can drop even more to test the $2,147 support level if it drops below the aforementioned level.
However, if ETH’s price touches the SMA and bounces back, it will move upward toward the $4,099 resistance level. Also, should it break below this resistance level, it will continue to move up to test the $4,863 level. ETH may move to create a new high if it rises above the $4,863 level.
As of the time of writing, ETH’s price was trading at around $3,694 and was up by 0.41% with a market capitalization of over $443 billion and a 24-hour trading volume of over $18 billion. Its market capitalization is down by 2.97%, while its trading volume is up by 39.28% in the past day.
Featured image from iStock, chart from Tradingview.com
- SEO Powered Content & PR Distribution. Get Amplified Today.
- PlatoData.Network Vertical Generative Ai. Empower Yourself. Access Here.
- PlatoAiStream. Web3 Intelligence. Knowledge Amplified. Access Here.
- PlatoESG. Carbon, CleanTech, Energy, Environment, Solar, Waste Management. Access Here.
- PlatoHealth. Biotech and Clinical Trials Intelligence. Access Here.
- Source: https://www.newsbtc.com/news/ethereum/ethereum-drops-below-4-hour-sma-analyzing-the-impact/

