In a technical analysis, crypto analyst Dark Defender has provided a bullish perspective on the XRP price action, indicating that the cryptocurrency is on the cusp of a potential breakout. The analysis presented is based on a daily chart that encapsulates several advanced technical indicators and theories.
Why A XRP Price Breakout Is Imminent
The core of Dark Defender’s analysis is the completion of a five-wave corrective structure, as posited by Elliott Wave Theory. This theory suggests that markets move in repetitive cycles, with the five-wave pattern indicating a correction following a larger trend.
In XRP’s case, the waves numbered (1) to (5) illustrate a complete correction within a larger bullish context. The implication is that the completion of this pattern could lead to the start of an impulsive, upward wave sequence.
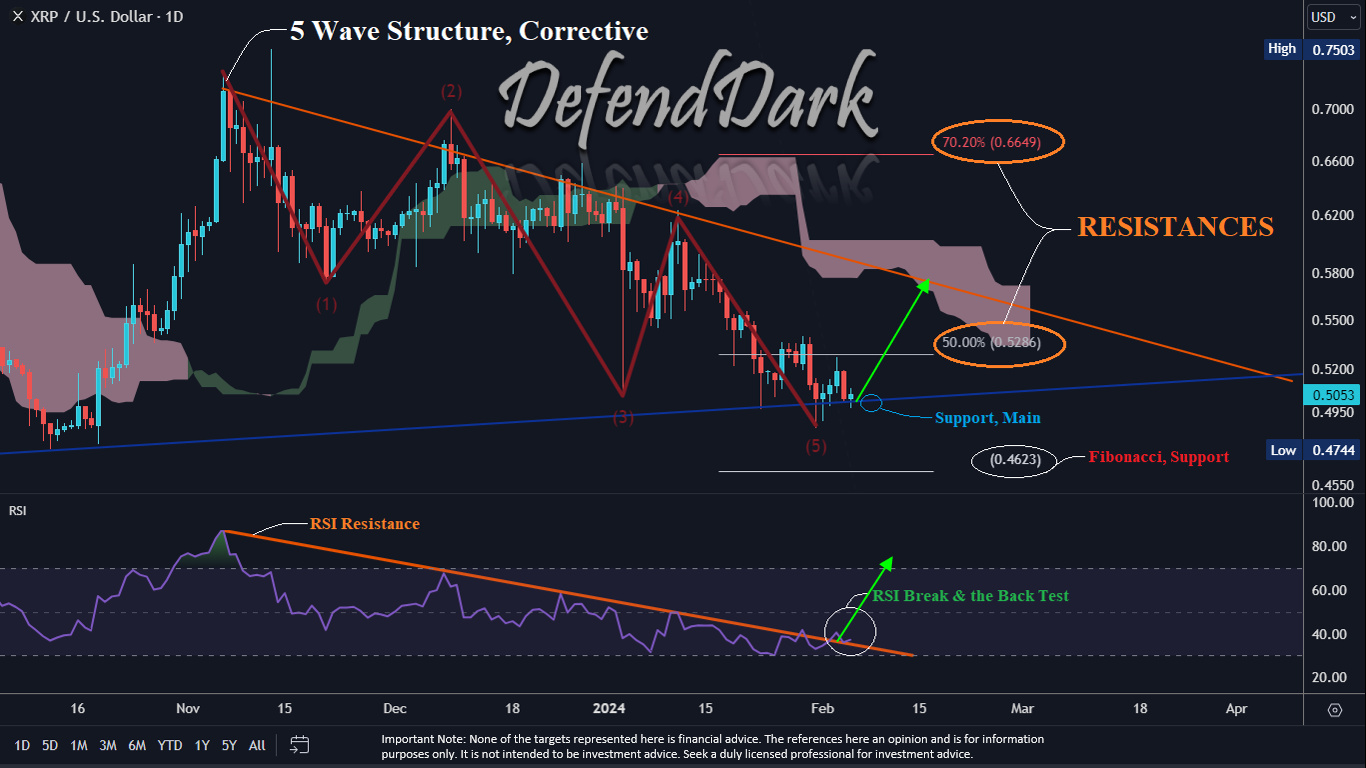
Dark Defender points to the critical support level at $0.4623, a value derived from Fibonacci retracement analysis. Fibonacci retracements are based on the idea that markets will retrace a predictable portion of a move, after which they will continue to move in the original direction. The $0.4623 level appears to be a strong area of buyer interest, representing a potential reversal zone.
On the resistance side, two levels are highlighted. The first is set at $0.5286, which is the 50% retracement level from the previous high. This price point acts as an interim hurdle for XRP’s price, serving as a barometer for short-term sentiment. A more significant resistance is noted at the 70.2% Fibonacci level of $0.6649. A break above this level could be a strong indication of bullish momentum and may attract further buying interest.
The chart also incorporates the Ichimoku Cloud, which is currently acting as dynamic resistance. The Ichimoku Cloud is a multifaceted indicator that provides information on support and resistance, trend direction, momentum, and buy or sell signals. A decisive breakout above the cloud would suggest a change in trend favoring the bulls.
Remarkably, the Ichimoku Cloud aligns with a descending trend line (red line). A break above both indicators could spell strong bullish momentum.
Another compelling aspect of the analysis is the RSI breakout and subsequent retest. The RSI is a momentum oscillator used to identify overbought or oversold conditions. In XRP’s case, the RSI had previously been in a downtrend, indicating persistent selling pressure. However, the recent ‘break and back test’ pattern in the RSI, where the price breaks through a resistance level and then retests it as support, demonstrates a potential shift in momentum from bearish to bullish.
Dark Defender’s analysis indicates that the combination of a completed corrective structure, a supportive RSI movement, and the challenge of key Fibonacci levels suggests that XRP is primed for an upward trajectory. His closing statement, “And come on, XRP, it is time for you to Move!” encapsulates the anticipation of a bullish phase for XRP in the near future.
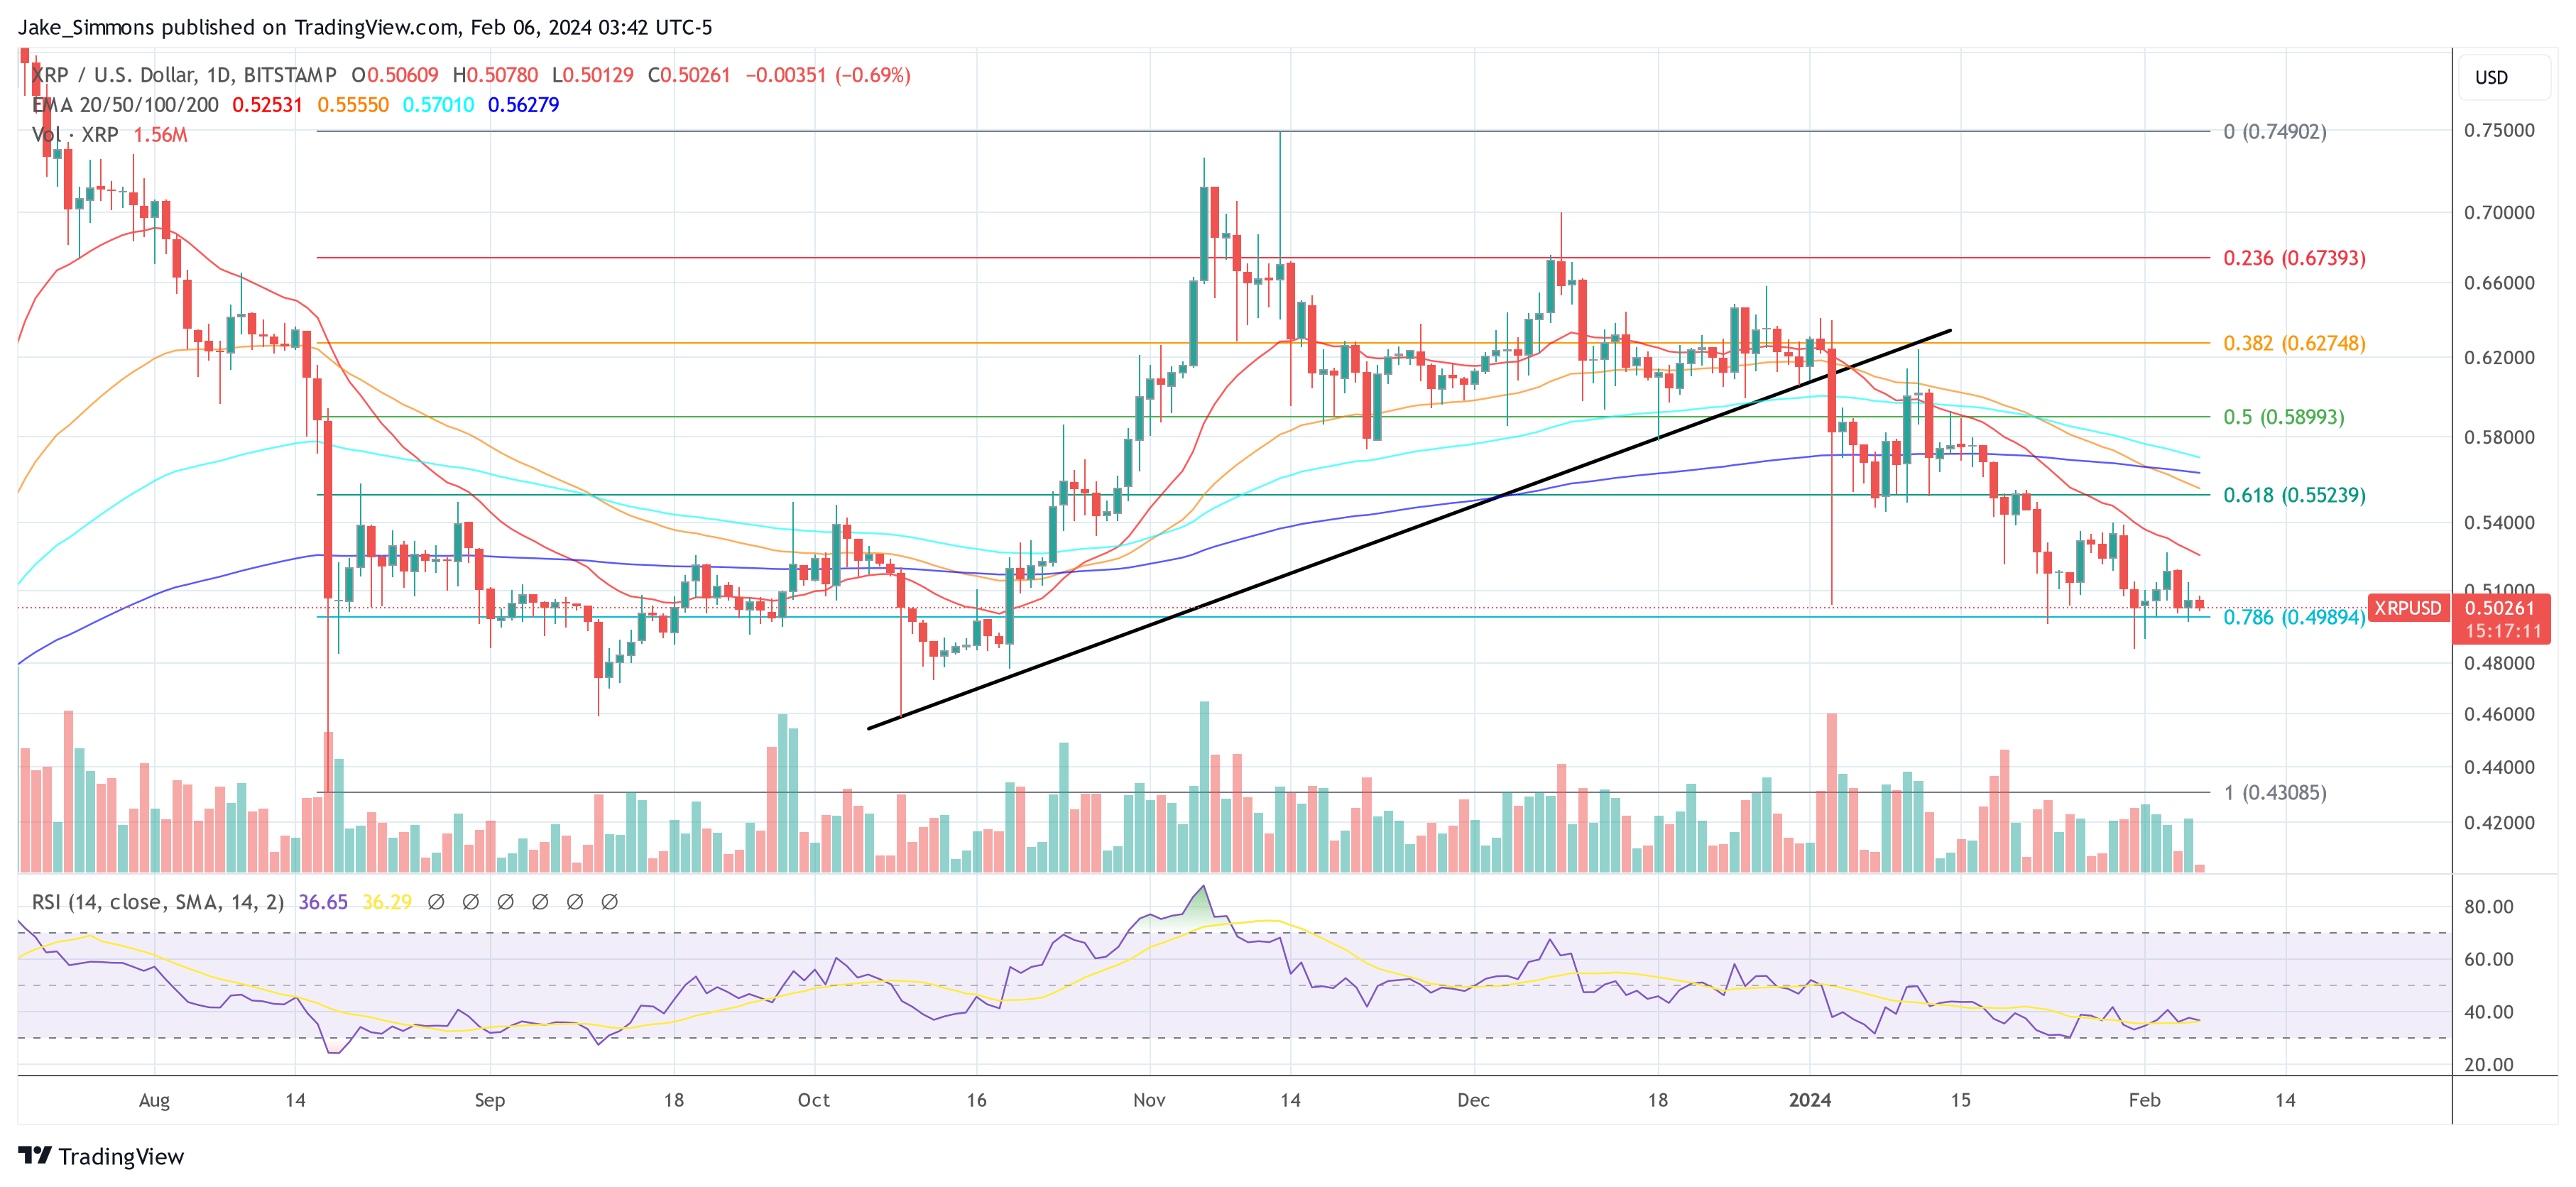
At press time, XRP traded at $0.50261.
Featured image created with DALL·E, chart from TradingView.com
Disclaimer: The article is provided for educational purposes only. It does not represent the opinions of NewsBTC on whether to buy, sell or hold any investments and naturally investing carries risks. You are advised to conduct your own research before making any investment decisions. Use information provided on this website entirely at your own risk.
- SEO Powered Content & PR Distribution. Get Amplified Today.
- PlatoData.Network Vertical Generative Ai. Empower Yourself. Access Here.
- PlatoAiStream. Web3 Intelligence. Knowledge Amplified. Access Here.
- PlatoESG. Carbon, CleanTech, Energy, Environment, Solar, Waste Management. Access Here.
- PlatoHealth. Biotech and Clinical Trials Intelligence. Access Here.
- Source: https://www.newsbtc.com/xrp-news/crypto-analyst-xrp-price-ready-for-takeoff/

