
Published 1 day ago
A bullish breakout from the resistance trendline of a long-coming symmetrical triangle pattern brings a recovery opportunity for Apecoin holders. This breakout will release the trapped bullish momentum and free the Ape price from the ongoing consolidation phase. Thus, how far may the potential rally will surge this altcoin.?
advertisement
Key points:
- In ideal bullish conditions, the symmetrical triangle breakout may push the Apecoin price to $6
- The 100-day EMA slope wavering near the $4.2 local resistance will try to offset the bullish thesis
- The intraday trading volume in Apecoin is $104.5. Million, indicating a 18% gain
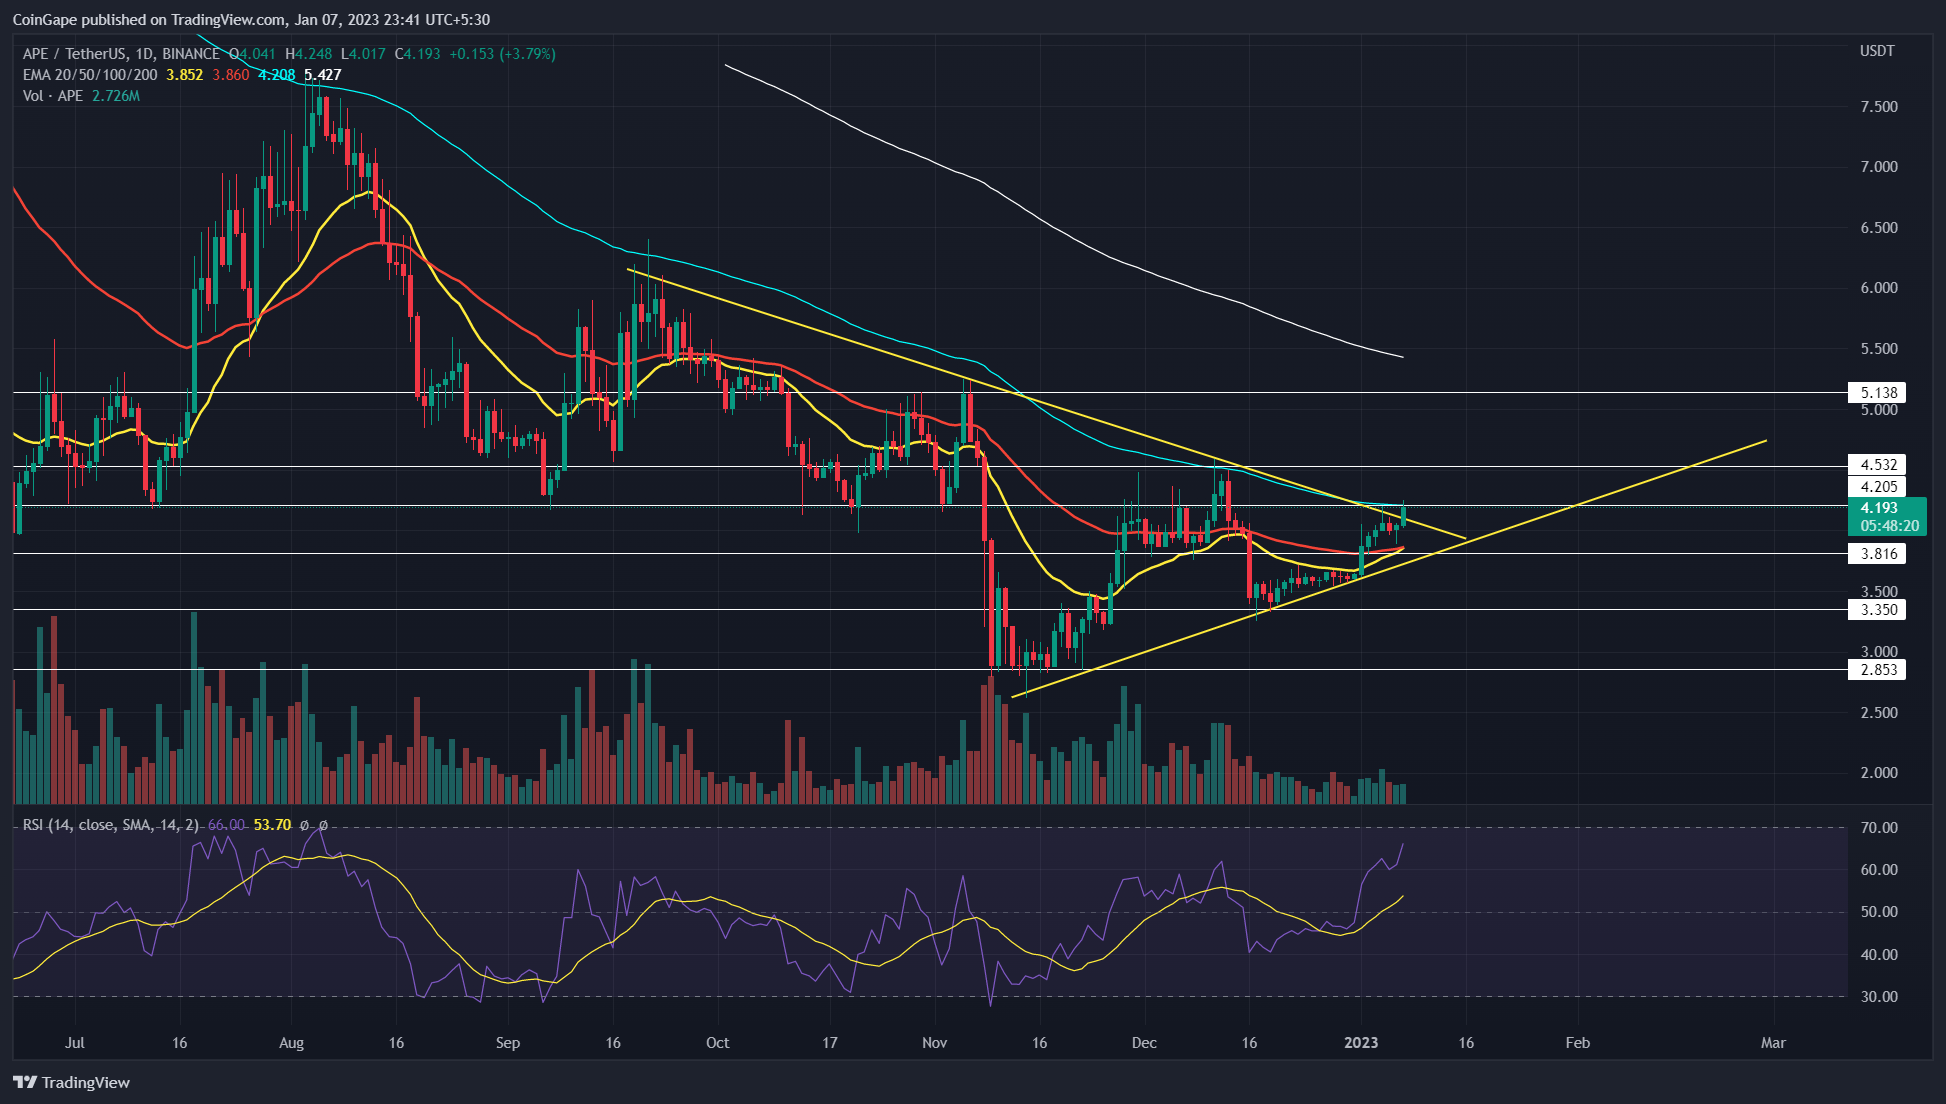
Source- Tradingview
For the last four months, the Apecoin price has been moving under the influence of a solid resistance trendline and the 100-day EMA. However, in the last two months, growth in market demand has led to a 47% recovery and a support trendline in the daily chart.
Thus, the converging trendline displays the formation of a symmetrical triangel pattern in the daily time frame chart. Moreover, the price action displays the recent recovery rally breaking above the pattern’s resistance trendline, highlighting a bullish entry spot. However, the opposing trend in the daily volumes also warns of a failure.
Trending Stories
Also Read: Explained: What is Physical NFT? and How to Sell Physical Items as NFT
Today the coin price trades at $4.18 with an intraday gain of 3.3%, resulting in a bullish engulfing candle in the daily chart.
If the daily candle closes above the resistance trendline, an uptrend above the 100-day EMA will reach the overhead resistance of $5.1. Thus, the Apecoin price is expected to rise by 23% in the first few months of 2023.
On a contrary note, if the selling price drives the closing price under $4.2, the price may resonate further within the triangle pattern with increased fallout possibility.
Technical Indicator
Relative Strength Index: despite the Lower high peaks forming under the influence of the resistance trendline, the RSI slope shows a bullish growth. Thus leading to a bullish divergence in the daily chart.
advertisement
EMAs: the 20 and 50-day EMA in the daily chart give a bullish crossover. Meanwhile, the market price jumps to challenge the 100-day EMA. A spike in market price is very likely if the bearish influence of the 100-day EMA ends.
Apecoin intraday price levels
- Spot price: $4.18
- Trend: Bullish
- Volatility: low
- Resistance level- $4.2 and $4.53
- Support level- $3.8 and $3.35
Share this article on:
The presented content may include the personal opinion of the author and is subject to market condition. Do your market research before investing in cryptocurrencies. The author or the publication does not hold any responsibility for your personal financial loss.
- SEO Powered Content & PR Distribution. Get Amplified Today.
- Platoblockchain. Web3 Metaverse Intelligence. Knowledge Amplified. Access Here.
- Source: https://coingape.com/markets/bullish-pattern-breakout-sets-apecoin-price-for-24-rise-buy-now/

