While Bitcoin (BTC) has continued a downtrend, the asset has recently recorded a high volume in daily transactions nearing its all-time high. According to a report by on-chain analytics provider Glassnode, “Bitcoin daily transaction counts are approaching All-time-highs, seeing an explosive uptick in 2023.’
Regardless of this news, Bitcoin has continued to move downward after its weekend plateau of trading at just between $29,300. The asset trading volume has also surged slightly indicating a possible violent sell-off.
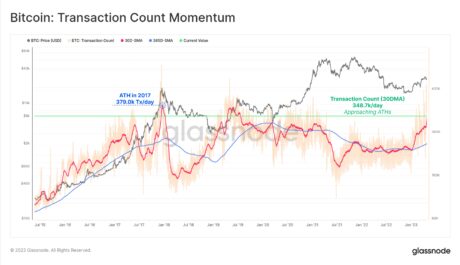
Bitcoin Records Daily Transactions Nearing Peak Levels
According to Glassnode, on the 30-day moving average, Bitcoin daily transactions have reached an amount of 348,700. While the peak level which was seen in 2017 remains at 379,000 transactions per day. This has proved Bitcoin’s daily transactions are beginning to near the all-time high last seen about 5 years ago.
Furthermore, according to the Glassnode report, this surge in Bitcoin daily transactions is thanks to the Ordinal inscriptions. The Ordinal inscriptions also known as Bitcoin non-fungible tokens (NFTs), or Ordinals, are inscriptions (digital artifacts) inscribed on satoshis (sats) – little units of Bitcoin.
Glassnode noted the inscription accounts for approximately 30% to 40% of mined transactions and 10% to 20% of fees paid. Meanwhile, the remaining majority of transactions are monetary in nature, frequently conducted through exchanges.
According to Glassnode, compared to Ordinals activity on the Bitcoin blockchain, BTC exchange activity is relatively low, representing roughly 30% of fees and transactions.
The trend of creating inscriptions initially gained popularity in February when users started inscribing NFTs on satoshis. However, the recent resurgence has been dominated by inscriptions that are based on text.
Glassnode noted:
Bitcoin transaction counts, address activity, Inscriptions, and Mempool congestion are all elevated. As is the degree of HODLing, and supply acquired below $30k. Conviction remains.
BTC Continues Downtrend
Bitcoin (BTC) is yet to make any significant move in the past few days. Instead, it has only seemed to pick up from where it left off in its downward trend in recent weeks. Over the past 24 hours, the top crypto has plummeted nearly 4% with a market price of $28,435, at the time of writing.
This downtrend follows a notable fall from the $30,000 region in recent weeks. So far, Bitcoin has a 24-hour range between a low of $28,315 and a high of $29,944.
Meanwhile, the BTC market cap is still in the green while its trading volume signals selling pressure, indicating a possible continuous bearish trend.
Over the past week, Bitcoin’s market capitalization has surged from a low of $528 billion on April 24 to as high as $550 billion as of today. Its trading volume has also spiked from a daily trading volume of $15.4 billion to $19.8 billion, over the same time period.
Featured image from Unsplash, Chart from TradingView
- SEO Powered Content & PR Distribution. Get Amplified Today.
- PlatoAiStream. Web3 Data Intelligence. Knowledge Amplified. Access Here.
- Minting the Future w Adryenn Ashley. Access Here.
- Source: https://www.newsbtc.com/news/bitcoin/bitcoin-btc-continues-downtrend-despite-daily-transactions/

