
Published 2 hours ago
The Quant price daily chart shows the completion of an ascending triangle pattern. As per the technical setup, the pattern offers a target of the same distance between the neckline and the lowest swing low shot from the breakout point. Thus, the recent breakout from this pattern should assist buyers in surpassing the $150 mark.
advertisement
Key points:
- A rising trendline maintains the ongoing recovery in Quant price
- The recently reclaimed EMAs(20, 50, 100, and 200) should offer additional support for prices to jump higher.
- The intraday trading volume in the Quant is $48 Million, indicating a 60% gain
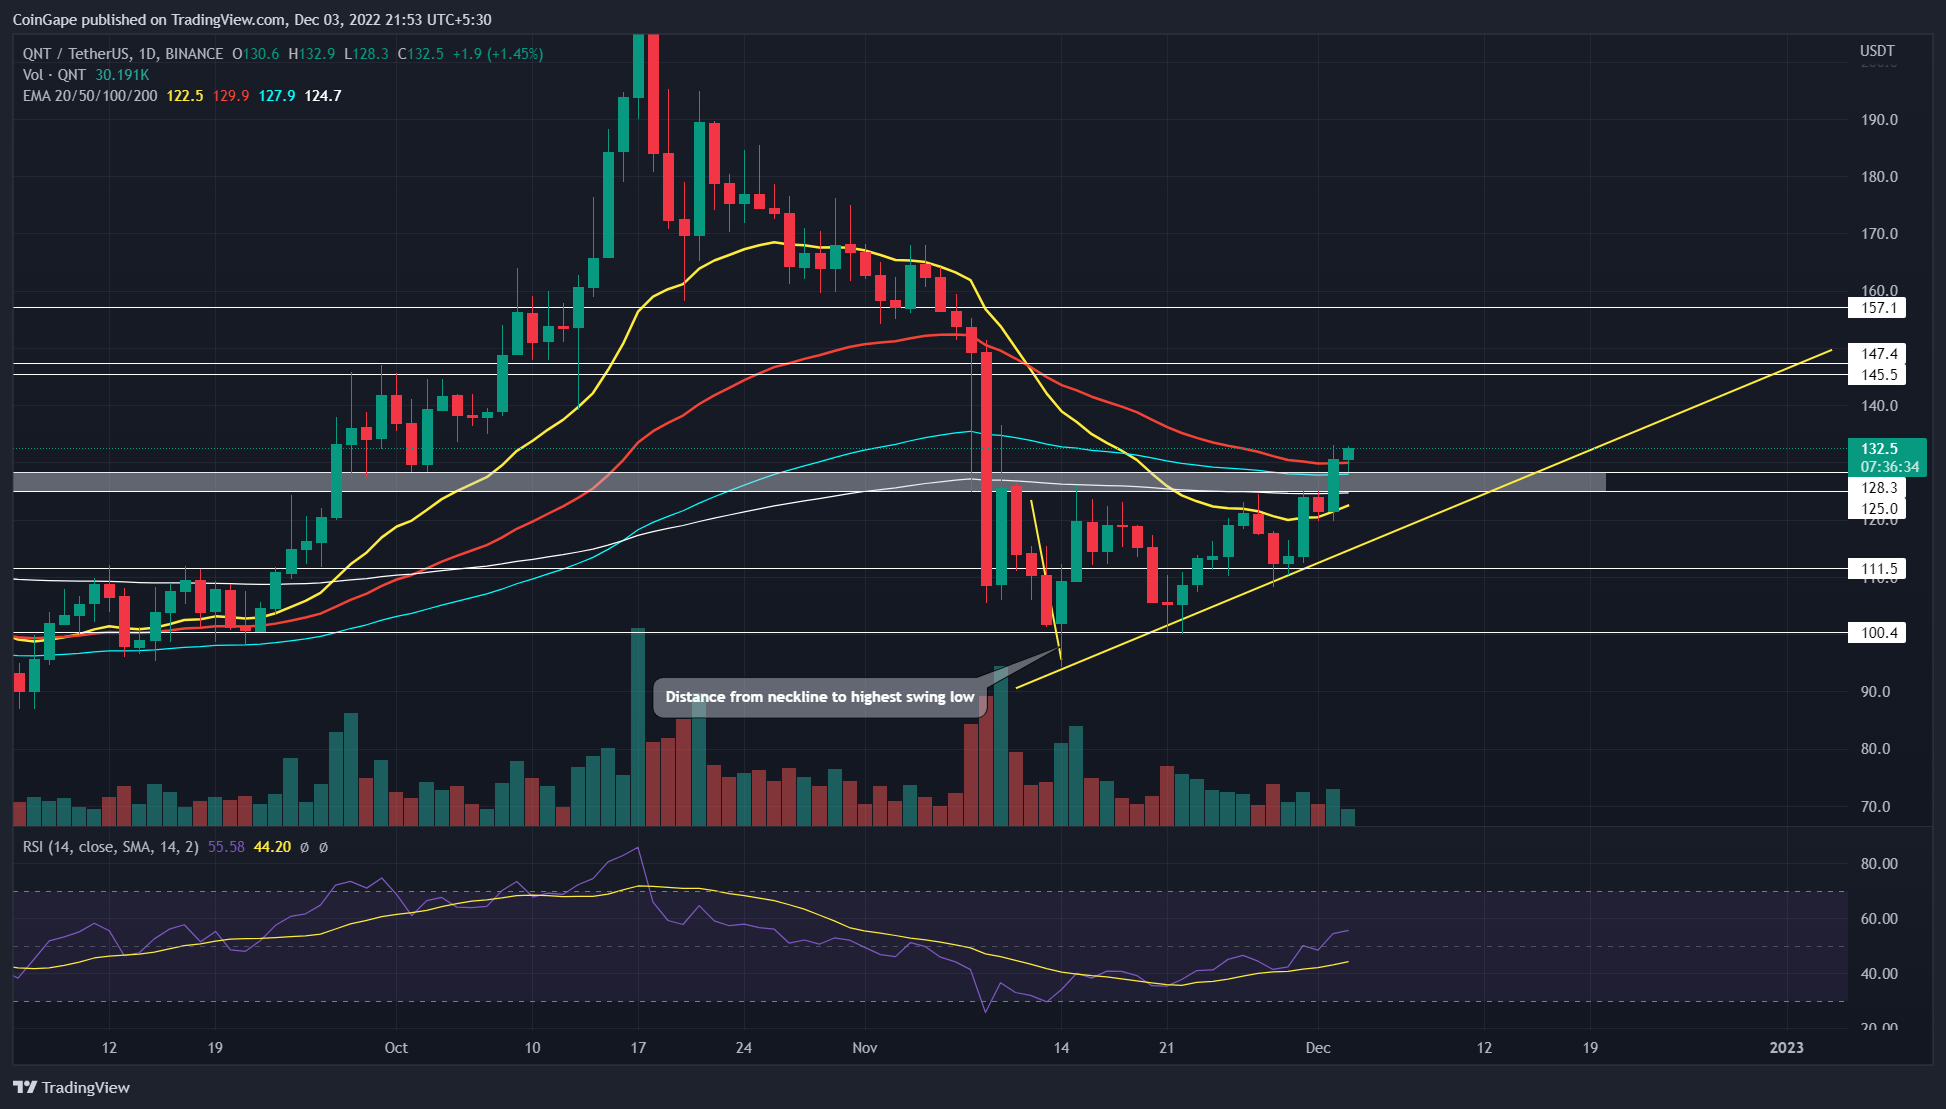
Source-Tradingview
Amid the recent consolidation in the crypto market, the Quant price resonated in an ascending triangle pattern. Moreover, the coin price thrice tested the pattern’s support trendline and neckline resistance of $128-125, indicating that traders strictly respond to its technical setup.
In theory, this bullish continuation pattern indicates a gradual growth in buying momentum, as prices are rising with the support of ascending trendline. Furthermore, on December 2nd, the QNT price gave a decisive breakout from the $128 neckline, triggering the aforementioned pattern. This breakout with a significant volume rise, indicating the buyers are aiming to reclaim a higher price.
Trending Stories
Today, the Quant price retested the breached resistance and continued with a post-retest rally. Currently, the altcoin trades at $132.2 with an intraday gain of 1.3%. However, with sustained buying, the price should surge 18.5% to reach the $157 resistance.
On a contrary note, if the coin price reverts lower and breaches the support trendline, the bullish thesis will get invalidated.
Technical Indicator
Relative Strength Index: the daily-RSI slope jumps above the neutral line, indicating the market sentiment holds a positive outlook for Quant coin price.
advertisement
EMAs: Along with the pattern’s neckline resistance, the rising price breached a cluster of crucial EMA(20, 50, 100, and 200). In addition, these EMAs wavering at the $128 mark heightens the importance of this reclaimed horizontal level.
Quant intraday price levels
- Spot price: $132.6
- Trend: Bullish
- Volatility: Low
- Resistance level- $147-145 and $157
- Support level- $111.5 and $100
Share this article on:
The presented content may include the personal opinion of the author and is subject to market condition. Do your market research before investing in cryptocurrencies. The author or the publication does not hold any responsibility for your personal financial loss.
- SEO Powered Content & PR Distribution. Get Amplified Today.
- Platoblockchain. Web3 Metaverse Intelligence. Knowledge Amplified. Access Here.
- Source: https://coingape.com/markets/a-bullish-pattern-sets-quant-price-on-18-5-growth-buy-now/

