- The Canadian dollar weakened as Canada’s inflation eased in May.
- Some Fed policymakers called for rate hikes if inflation continued to beat forecasts.
- Next week, the US and Canada will release their GDP reports.
The USD/CAD weekly forecast shows bullish sentiment as the policy outlook divergence between the Fed and the Canadian dollar widens.
Ups and downs of USD/CAD
The USD/CAD pair had a bullish week as the dollar strengthened on upbeat data and hawkish Fed minutes. Meanwhile, the Canadian dollar weakened as Canada’s inflation eased in May.
–Are you interested in learning more about forex tools? Check our detailed guide-
The FOMC meeting minutes released on Wednesday showed that policymakers were ready to hold restrictive policy for long to tame stubborn inflation. Additionally, some policymakers called for rate hikes if inflation continued to beat forecasts. Consequently, investors scaled back expectations for a rate cut in September.
Furthermore, the US released PMI data showing better-than-expected business activity in the manufacturing and services sectors. Meanwhile, data from Canada showed cooling inflation, raising bets for a June rate cut by the Bank of Canada.
Next week’s key events for USD/CAD
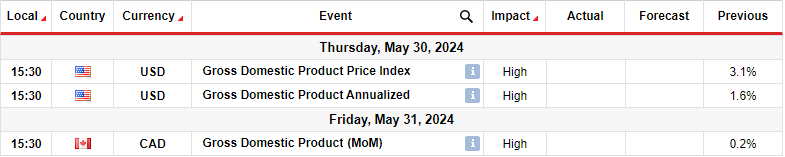
Next week, the US and Canada will release their Gross Domestic Product reports, which will show the state of their economies. These reports will significantly define the gap in policy outlooks between the US and Canada.
A bigger-than-expected figure in the US would indicate a robust economy, likely leading to a decline in Fed rate cut expectations.
Meanwhile, the GDP report is more likely to reveal a slowdown in Canada, which would pressure the BoC to cut rates and increase the divergence in policy outlooks.
USD/CAD weekly technical forecast: Bears retest bullish trendline

On the technical side, the USD/CAD price is in a bullish trend that has paused after reaching the 1.3800 key resistance level. After hitting this level, the price entered a period of consolidation, chopping through the 22-SMA. Moreover, the price has traded with the nearest support at 1.3600 and the nearest resistance at 1.3800.
–Are you interested in learning more about the best crypto exchange? Check our detailed guide-
However, on a larger scale, the price has maintained its position above a bullish trendline. Moreover, it has consistently made higher highs and lows. Currently, the price is trading near the trendline, which has acted as support several times. Therefore, the price might bounce off this trendline to retest the 1.3800 resistance. A break above this level would make a higher high to continue the uptrend.
Looking to trade forex now? Invest at eToro!
68% of retail investor accounts lose money when trading CFDs with this provider. You should consider whether you can afford to take the high risk of losing your money.
- SEO Powered Content & PR Distribution. Get Amplified Today.
- PlatoData.Network Vertical Generative Ai. Empower Yourself. Access Here.
- PlatoAiStream. Web3 Intelligence. Knowledge Amplified. Access Here.
- PlatoESG. Carbon, CleanTech, Energy, Environment, Solar, Waste Management. Access Here.
- PlatoHealth. Biotech and Clinical Trials Intelligence. Access Here.
- Source: https://www.forexcrunch.com/blog/2024/05/26/usd-cad-weekly-forecast-fed-boc-policy-gap-widening/

