From the Bureau of Transportation Statistics:

U.S. airline financial reports are filed quarterly with the Bureau of Transportation Statistics (BTS). See the tables that accompany this release on the BTS website for additional first-quarter (Tables 1-6) financial results.
1Q 2023 Results for All 26 Scheduled U.S. Passenger Airlines
U.S. scheduled passenger airlines reported a first-quarter 2023 after-tax net loss of $1.2 billion and a pre-tax operating gain of $32 million.
One year earlier, in the first quarter of 2022, the airlines reported an after-tax net loss of $5.1 billion and a pre-tax operating loss of $5.2 billion.
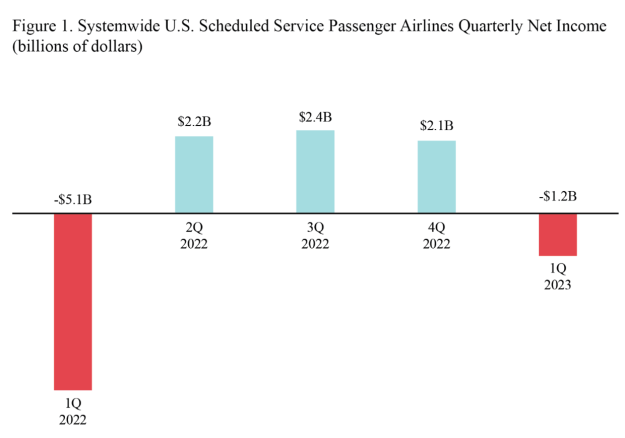
After-tax net income
- $1.2 billion loss in 1Q 2023
- Compared to $2.1 billion gain in 4Q 2022
- Compared to $5.1 billion loss in 1Q 2022
Pre-tax operating profit
- $32 million gain in 1Q 2023
- Compared to $3.7 billion gain in 4Q 2022
- Compared to $5.2 billion loss in 1Q 2022
- Total 1Q 2023 operating revenue: $52.9 billion
- Share of total 1Q 2023 operating revenue:
- Fares: $39.5 billion, 74.6%, compared to 68.9% in 1Q 2022
- Baggage fees: $1.7 billion, 3.3%, compared to 3.7% in 1Q 2022
- Reservation change fees: $256 million, 0.5%, compared to 0.6% in 1Q 2022
- Share of total 1Q 2023 operating revenue:
Fees are included for calculations of net income, operating revenue and operating profit or loss.
- Total 1Q 2023 operating expenses: $52.9 billion:
- Share of total 1Q 2023 operating expenses:
- Fuel: $12.0 billion, 22.6%, compared to 19.5% in 1Q 2022
- Labor: $17.7 billion, 33.4%, compared to 34.2% in 1Q 2022
- Share of total 1Q 2023 operating expenses:
Domestic operations, includes 26 U.S. airlines:
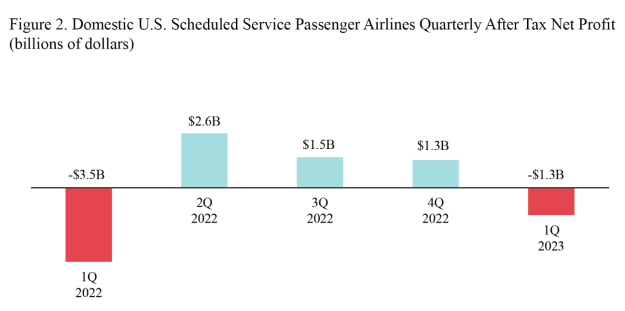
After-tax domestic net profit (net income)
- $1.3 billion loss in 1Q 2023
- Compared to $1.3 billion gain in 4Q 2022
- Compared to $3.5 billion loss in 1Q 2022
Pre-tax domestic operating profit
- $403 million loss in 1Q 2023
- Compared to $2.7 billion gain in 4Q 2022
- Compared to $3.6 billion loss in 1Q 2022
- 1Q 2023 domestic operating revenue: $40.4 billion
- Share of total 1Q 2023 domestic operating revenue:
- Fares: $29.2 billion, 72.4%, compared to 68.3% in 1Q 2022
- Baggage fees: $1.4 billion, 3.5%, compared to 3.7% in 1Q 2022
- Reservation change fees: $219 million, 0.5%, compared to 0.6% in 1Q 2022
- Share of total 1Q 2023 domestic operating revenue:
Fees are included for calculations of net income, operating revenue and operating profit or loss.
- 1Q 2023 domestic operating expenses: $40.8 billion, of which:
- Share of total 1Q 2023 domestic operating expenses:
- Fuel: $8.6 billion, 21.0%, compared to 18.0% in 1Q 2022
- Labor: $13.6 billion, 33.4%, compared to 33.9% in 1Q 2022
- Share of total 1Q 2023 domestic operating expenses:
International operations, includes 20 U.S. airlines:
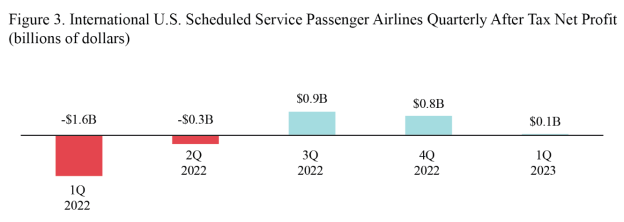
After-tax international net profit (net income)
- $53 million gain in 1Q 2023
- Compared to $782 million gain in 4Q 2022
- Compared to $1.6 billion loss in 1Q 2022
Pre-tax international operating profit
- $436 million gain in 1Q 2023
- Compared to $982 million gain in 4Q 2022
- Compared to $1.6 billion loss in 1Q 2022
- 1Q 2023 international operating revenue: $12.5 billion, of which:
Fees are included for calculations of net income, operating revenue and operating profit or loss.
- 1Q 2023 international operating expenses: $12.1 billion, of which:
- Share of 1Q 2023 international operating expenses:
- Fuel: $3.4 billion, 28.2%, compared to 25.4% in 1Q 2022
- Labor: $4.0 billion, 33.5%, compared to 35.6% in 1Q 2022
- Share of 1Q 2023 international operating expenses:
1st Quarter Margins
Net margin is the net income or loss as a percentage of operating revenue. Operating margin is the operating profit or loss as a percentage of operating revenue.
Systemwide:
Net income margin:
- -2.3% in 1Q2023
- Compared to -13.1% in 1Q2022
Operating margin:
- 0.1% in 1Q2023
- Compared to -13.3% in 1Q2022
Domestic
Net income margin:
- -3.2% in 1Q2023
- Compared to -11.1% in 1Q2022
Operating margin:
- -1.0% in 1Q2023
- Compared to -11.4% in 1Q2022
International
Net income margin:
- 0.4% in 1Q2023
- Compared to -21.7% in 1Q2022
Operating margin:
- 3.5% in 1Q2023
- Compared to -21.0% in 1Q2022
Reporting notes
Additional data: BTS website, see tables for operating profit/loss, operating revenue and fuel cost and consumption. See the BTS financial databases for more detailed data including numbers for individual airlines.
Filing requirement: By regulation, for the quarter ending Dec. 31, airlines that operate at least one aircraft that is designed/certified for more than 60 seats or the capacity to carry a payload of passengers and cargo weighing more than 18,000 pounds must report financial data to BTS by March 31. The airline filings are subject to a process of quality assurance and data validations before release to the public.
Data updates: Revised carrier data and late data filings will be made available monthly on TranStats on the Monday following the second Tuesday of the month. All data are subject to revision. BTS will release second-quarter 2023 data on September 18.
Missing carriers: The information provided within BTS statistical releases may not be based on 100% of reporting carriers. Generally, data are released per schedule if reports have been received from at least 90% of the carriers, along with data from all the major carriers. Regarding this release, the following carriers remain pending: Aloha Air Cargo (KH), Elite Airways LLC (2HQ), Northern Air Cargo Inc. (NC), Scott Aviation, LLC (3EQ). Also, within text, percent change results may not be exact due to rounding.
- SEO Powered Content & PR Distribution. Get Amplified Today.
- EVM Finance. Unified Interface for Decentralized Finance. Access Here.
- Quantum Media Group. IR/PR Amplified. Access Here.
- PlatoAiStream. Web3 Data Intelligence. Knowledge Amplified. Access Here.
- Source: https://worldairlinenews.com/2023/06/13/us-airlines-lose-1-2-billion-in-first-quarter-2023-an-improvement-over-first-quarter-2022/

