Tag: margin
Why You Should Care about End-to-End Supply Chain Visibility

Just as COVID-19 vaccine distribution efforts began helping the global economy emerge from the economic impact of the pandemic, the Suez Canal disruption hit. Now that the Canal is open again, the global supply chain is adjusting to yet another “black swan” event – and recognizing the need for end-to-end supply chain visibility.
Tuju Setia Berhad

Follow us on facebook: https://www.facebook.com/LCH-Trading-Signal-103388431222067/
Open to apply: 26/04/2021
Close to apply: 05/05/2021
Listing date: 19/05/2021
Market Cap: RM221.780mil
Total Shares: 316.828mil shares (Public apply: 15.842mil, Company Insider/Miti/Private Placement/other: 91.683mil)
Building construction for Residential & Non-residential buidling.
Tuju Setia: 6.4% (average 4 year 3.81%)
WCT: -10.8%
Suncon: 4.7%
Kerjaya: 11.2%
Vizione: -2.2%
GDB: 6.8%
Inta bina: 2.9%
TCS: 6.7%
Gagasan Nadi Cergas: 5.4%
M'sia: 100%
1.Market: Main Market
2.Price: RM0.70 (EPS:RM0.0513)
3.P/E: PE13.65
4.ROE(Pro Forma III): 16.5%
5.ROE: 30%(2020), 35%(2019), 31%(2018), 33%(2017)
6.Cash & fixed deposit after IPO: RM0.2458 per shares
7.NA after IPO: RM0.31
8.Total debt to current asset after IPO: 0.66 (Debt: 135.120mil, Non-Current Asset: 31.077mil, Current asset: 202.352mil)
9.Dividend policy: PAT 25% dividend policy.
2020: RM255.768 mil (Eps: 0.0636)
2019: RM421.635 mil (Eps: 0.0369)
2018: RM327.794 mil (Eps: 0.0281)
2017: RM292.385 mil (Eps: 0.0230)
2020: 6.36%
2019: 3.69%
2018: 2.71%
2017: 2.5%
2021: RM21.914 mil
2022: RM174.353 mil
2023: RM388.437 mil
2024: RM365.53 mil
Wee Eng Kong: 44.37%
Dato' Wee Beng Aun: 21.86%
Wee Beng Chuan: 0.16%
Datin Seri Raihanah: 0.08%
Loo Ming Chee: 0.08%
Nor Adha bin Yahya: 0.08%
Total director remuneration: RM2.084 mil or 8.96%
key management remuneration: RM1.45 mil - 1.7mil or 6.23%-7.30%
total (max): RM3.784 mil or 16.27%
Capital Expenditure (Machines/equitment/Software): 42.86%
Capital Expenditure (Land/storage facilities): 14.28%
Working capital: 33.93%
Listing expenses: 8.93%
1. PE13.65 is not too high & have good ROE.
2. Still have some order book to sustain revenue until 2024.
3. Have clear dividend policy.
4. Most IPO fund to expand business activities.
1. Company having high payable in liabilties. Grearing including payable is 2.49 in 2020.
2. Overall 4 year revenue almost no increase.
3. Major sharesholder age 60 & 63 (need more study on succession plan, & abilities of get new project).
4. RM13.3mil (70%) of working capital from IPO fund to pay subcontractor services (payable in liabilities RM104mil).
5. Net profit margin didn't exceed 10%.
6. Director & key management fees exceeded 10% of company gross profit.
Consider a normal IPO. Construction of buidling activities might need to take another few year in Malaysia to see better growth. Please refer below 3 year revenue & risk reward estimation.

10 reasons why IoT, and digitized shipment visibility adoption is an essential commodity for the supply chain industry

IoT is an essential enabler for real time supply chain visibility. High-level data gives users valuable insights into their merchandise's journey, including its geographical location and overall health status, and alongside predictive ETA's, can alert of any disruptions throughout the critical path.
We Asked Our Team To Define 2020 In One Word. Their Responses Are Interesting

As we all know, 2020 is a year like no other, so we asked some of our employees to describe 2020 in one word and share their hopes for 2021. Tap on the words to see what our team has to say!

Why You Need To Know About The Ripple Effect Of The Latest Disruption

Businesses and consumers globally, but especially within Asia and the Mediterranean, are already trying to manage delays in cargo shipments coming through the Suez Canal due to the Ever Given incident.
Volcano Berhad

Follow us on facebook: https://www.facebook.com/LCH-Trading-Signal-103388431222067/
Open to apply: 16/03/2021
Close to apply: 24/03/2021
Listing date: 06/04/2021
Market Cap: RM57.75mil
Total Shares: 165mil shares, Esos 49.5mil (Public apply: 8.25mil, Company Insider/Miti/Private Placement/other: 51.75mil)
Volcano: 28.82%
Nameplate Competitor (GP margin)
Chiyoda Integrco.(M) Sdn Bhd: 28.52%
Flexi Components Sdn Bhd: 39.91%
Sanwa Screen (M) Sdn Bhd: 42.43%
Plastic injection moulded Competitor (GP Margin)
Saha-Union: 13.5%
Srithai Superware: 8.64%
SNC former: 10.39%
Business
Manufacturing of nameplates, Plastic injection moulded.
M'sia: 4.17%
S'pore: 43.98%
Thailand: 44.11%
others: 7.74%
Fundamental
1.Market: Ace Market
2.Price: RM0.35 (EPS:RM0.205)
3.P/E: PE17 (based on EPS 0.205, we not accept IPO prospecture using EPS 0.0232 to cal PE)
4.ROE(Pro Forma III): 3.78%
5.ROE: 4.19%(2020), 11.18%(2019), 12.38%(2018)
6.Cash & fixed deposit after IPO: RM0.12 per shares
7.NA after IPO: RM0.408
8.Total debt to current asset after IPO: 0.1567 (Debt: 7.032mil, Non-Current Asset: 29.544mil, Current asset: 44.86mil)
9.Dividend policy: PAT 30% dividend policy.
Past Financial Performance (Revenue, Earning Per shares)
2020: RM52.527 mil (EPS:0.0205)
2019: RM55.892 mil (EPS:0.0290)
2018: RM58.649 mil (EPS:0.0412)
Net Profit Margin
2020: 28.82%
2019: 30.65%
2018: 32.35%
After IPO Sharesholding
Datuk Ch'ng Huat Seng: 16.97%
Gan Yew Thiam: 12.73%
Dato' Wong Tze Peng: 14.85%
Yeap Guan Seng: 6.36%
Khoo Boo Wui: 12.73%
Directors & Key Management Remuneration for FYE2021 (from gross profit 2020)
Total director remuneration: RM3.104 mil or 20.5%
key management remuneration: RM0.153mil - 0.3mil or 1.01%-1.98%
total (max): RM3.404mil or 22.48%
Use of fund
Purchase of machineries & equipment: 63.43%
Listing Expenses: 36.57%
Good thing is:
1. Purchase of 6 unit laser cutting machines will increase 33.33% nameplate production.
2. Purchase 5 unit of platic injection moulded will increase 15.56% capacity of production.
2. Have 30% PAT dividend policy.
3. Net profit is above 28% for past 3 years.
The bad things:
1. PE17 is a bit expensive.
2. For past 3 years, ROE is dropping.
3. Revenue did not grow for past 3 years.
4. Director remuneration is too expensive, 20.5% from the gross profit in 2020 pay for director remuneration.
5. Listing expenses 36.57% from IPO fund is too expensive.
With the additional machineries will increase the capacity of the company. However the company still some risk like over past 3 year revenue did not grow. Please refer below chart to view the company Business expension potential & risk rating.

4 Education Resources You May Have Missed This Month

Take a moment to read our roundup of content and resources to bring ideas, insight and inspiration into the week ahead – and beyond. While districts still face many challenges due to COVID, we also want to share the resilience and adaptability many districts have shown as they work to educate students in a “not so normal world.“
Fast Facts About Digital Transformation And The Pandemic

Our infographic highlights the benefits and importance of digitizing the supply chain and how users that deploy a supply chain management solution can analyze and act on the data derived from a fully connected, intelligent, and transparent supply chain. Read more about the benefits in our '5 WAYS DIGITAL TRANSFORMATION HELPS YOU MAKE INFORMED DECISIONS'
Flexidynamic Holdings Berhad
Close to apply: 16/03/2021
Listing date: 30/03/2021
Market Cap: RM56.778mil
Total Shares: 283mil shares (Public apply: 14.1 mil, Company Insider/Miti/Private Placement/other: 61.036mil)
Flexidynamic: RM31.31mil
Polydamic Group Bhd: RM11.78mil
Ripcol Industries S/B: RM17.2mil
Business
Design, engineering, installation, & commissioning of glove chlorination system.
M'sia: 86.28%
Vietnam: 4.38%
Thailand: 8.74%
Indonesia: 0.07%
Sri Lanka 0.53%
Fundamental
1.Market: Ace Market
2.Price: RM0.20 (EPS:RM0.0162)
3.P/E: PE12.35
4.ROE(Pro Forma III): 10.1%
5.ROE: 21.4%(2019), 24.8%(2018), 33%(2017)
6.Cash & fixed deposit after IPO: RM0.059 per shares
7.NA after IPO: RM0.12
8.Total debt to current asset after IPO: 0.708 (Debt: 31.832mil, Non-Current Asset: 21.998mil, Current asset: 44.976mil)
9.Dividend policy: Did not have formal dividend policy.
Past Financial Performance (Revenue, Earning Per shares)
2022: ***Remaining order book to be billed 2022 RM17.48mil
2021: ***order book to be billed Dec 2021 RM62.3mil
2020 (9mths): RM35.007 mil (EPS:0.0095)
2019: RM49.839 mil (EPS:0.0162)
2018: RM48.322 mil (EPS:0.0151)
2017: RM29.902 mil (EPS:0.0155)
Net Profit Margin
2020 (9mths): 7.62%
2019: 9.22%
2018: 9.14%
2017: 14.79%
After IPO Sharesholding
Tan Kong Leong: 41.53%
Liew Heng Wei: 18.74%
Phitchaya Arsangku: 2.21%
Directors & Key Management Remuneration for FYE2021 (from gross profit 2019)
Total director remuneration: RM1.168mil or 8.37%
key management remuneration: RM0.4mil- 0.5mil or 2.87%-3.58%
total (max): RM1.668mil or 11.95%
Use of fund
Repayment bank borrowing: 42.40% (purchase of 2 new factories 2019)
Renovation of new factories: 2.80%
Aquisition of machinery and equitment: 10.83%
Working capital: 24.03%
Listing Expenses: 19.94%
Good thing is:
1. Revenue increasing over 3 years.
2. Debt ratio not too dangerous level.
4. Major customer Hartalega, contribute to Flexidyamic revenue 2017-2020 (range 31.78%-40.91%).
1. Director fees & key managemnent remuneration already cost 11.95% from the company gross profit.
2. Net profit percentage dropping since 2017.
3. No fixed dividend policy.
4. ROE continue to fall over 3 years.
5. Industry player for top 2 & top 3 revenue RM17mil & RM11mil, showing this industry is not generate high revenue (possible less demand of the project needed).
Conclusions (Blogger is not wrote any recommendation & suggestion. All is personal opinion)
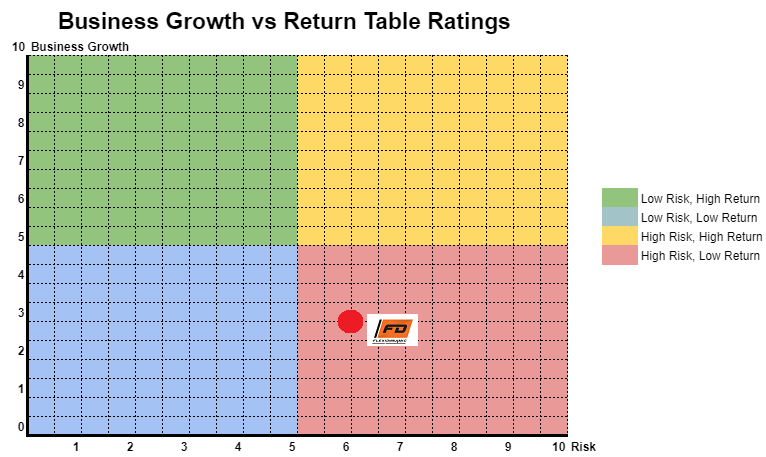
2020 is the high demand for glove, however did not see large improvement in net margin. The company secure RM62mil order book to be billed in 2021. We should see revenue able double at 2021 due to one off high demand order book due to the pandemic. After 2021, business revenue should back to normal phase. For business growth vs risk table please refer as below chart.
Beating Your Chemical Supply Chain Challenges | Roambee

Chemical supply chains stand at the crossroads of another upgrade; on one end there are traditional methods that pose challenges and on the other you have compelling technology solutions. Discover the significant challenges that lack of real-time visibility brings and how your organization can cope with them better.
Teladan Setia Group Berhad

Close to apply: 02/03/2021
Listing date: 16/03/2021
Market Cap: RM386.543mil
Total Shares: 805.298 mil shares (Public apply: 40 mil, Company Insider/Miti/Private Placement/other: 161.595mil)
Property development
Business mainly in Melaka
Residential: 51%
Mixed development: 49%
1.Market: Ace Market
2.Price: RM0.48 (EPS:RM0.054)
3.P/E: PE8.9
4.ROE(Pro Forma III): 10.36%
5.ROE: 12.60%(2019), 16.19%(2018), 22.27%(2017)
6.Cash & fixed deposit after IPO: RM0.1153 per shares
7.NA after IPO: RM0.54
8.Total debt to current asset after IPO: 0.56 (Debt: 214.877mil, Non-Current Asset: 266.719mil, Current asset: 381.972mil)
9.Dividend policy: 20% of PAT as dividend.
2020 (9mths): RM100.028 mil (EPS:0.022)
2019: RM232.988 mil (EPS:0.054)
2018: RM259.141 mil (EPS:0.061)
2017: RM359.511 mil (EPS:0.078)
2020 (9mths):19.1%
2019: 18.6%
2018: 18.8%
2017: 17.49%
Teo Lay Ban: 41.6%
Teo Lay Lee: 11.1%
Teo Siew May: 11.1%
Total director remuneration: RM1.678 mil or 2.08%
key management remuneration: RM0.90 mil-1.05mil or 1.12%-1.30%
total (max): RM2.728mil or 3.38%
Land acquisition: 45.3%
Working capital for project development: 42.8%
Repayment of bank borrowings: 5.2%
Listing Expenses: 6.7%
1. IPO price fair with the company value, PE8.9.
2. Have profit margin of 17%-19% rannge.
3. Directors & Key Management Remuneration is not too expensive.
1. Property development industry is effected by current overall economic.
2. ROE is less than 15%
Overall is fair valuation, but current economic situation is not encouraging property market to grow. Property market will need to wait at least more than 2 year to better demand. Invest in this IPO might need more time to wait and need to continue monitoring their performance. For business growth & business risk please refer to below chart.

Latest Intelligence

