1TB version ran out of cache before the end of our 450GB write
Our Verdict
This drive is a worthy competitor to Samsung's 980 Pro, at least in the 2TB version. The 1TB will run out of juice on very long writes, something the 980 Pro won't do. Regardless, for the price, an excellent SSD.
Sabrent must've read some of my articles and discovered my love of the color copper. The heat-spreader and the metal carrying case for the brand spanking new Rocket 4 Plus PCIe 4 NMVe SSD feature the color in copious amounts. I like it. Even if copper leaves you flat, the drive's stellar performance will grab your attention—it bested the Samsung 980 Pro in many tests. This is one of the best SSDs around.
Editor's note: This review originally published on December 21, 2020. As of late January 2022, Sabrent has upgraded the NAND in the Rocket 4 Plus to Micron's B47, which has increased its sustained throughput substantially in our follow-up testing in March. As of this addendum, it's the sixth fastest NVMe SSD we've tested under CrystalDiskMark, and the second fastest drive in our 48GB transfer tests, up from 8th place.
Specs and pricing
The NVMe SSDs we review all use the M.2 connector, and are 22 mm wide by 80 mm long (2280). The Rocket 4 Plus is an x4 PCIe 4.0 device featuring a Phison PS5018-E18 controller and 96-layer, Micron TLC NAND. Sabrent promises not to change to slower components, as has happened with a couple of SSD vendors recently. There's also 2MB of DRAM cache. NAND is treated as SLC for secondary caching to the tune of 25 percent.
The drives carry a 5-year warranty, and are rated for 350TBW per 500GB of capacity. TBW is the number or terabytes that may be written before the drive warranty lapses. It's quite likely capable of writing more, but that's the company's cut-off point for replacement. Most users are unlikely to come close to that in a decade.
Performance
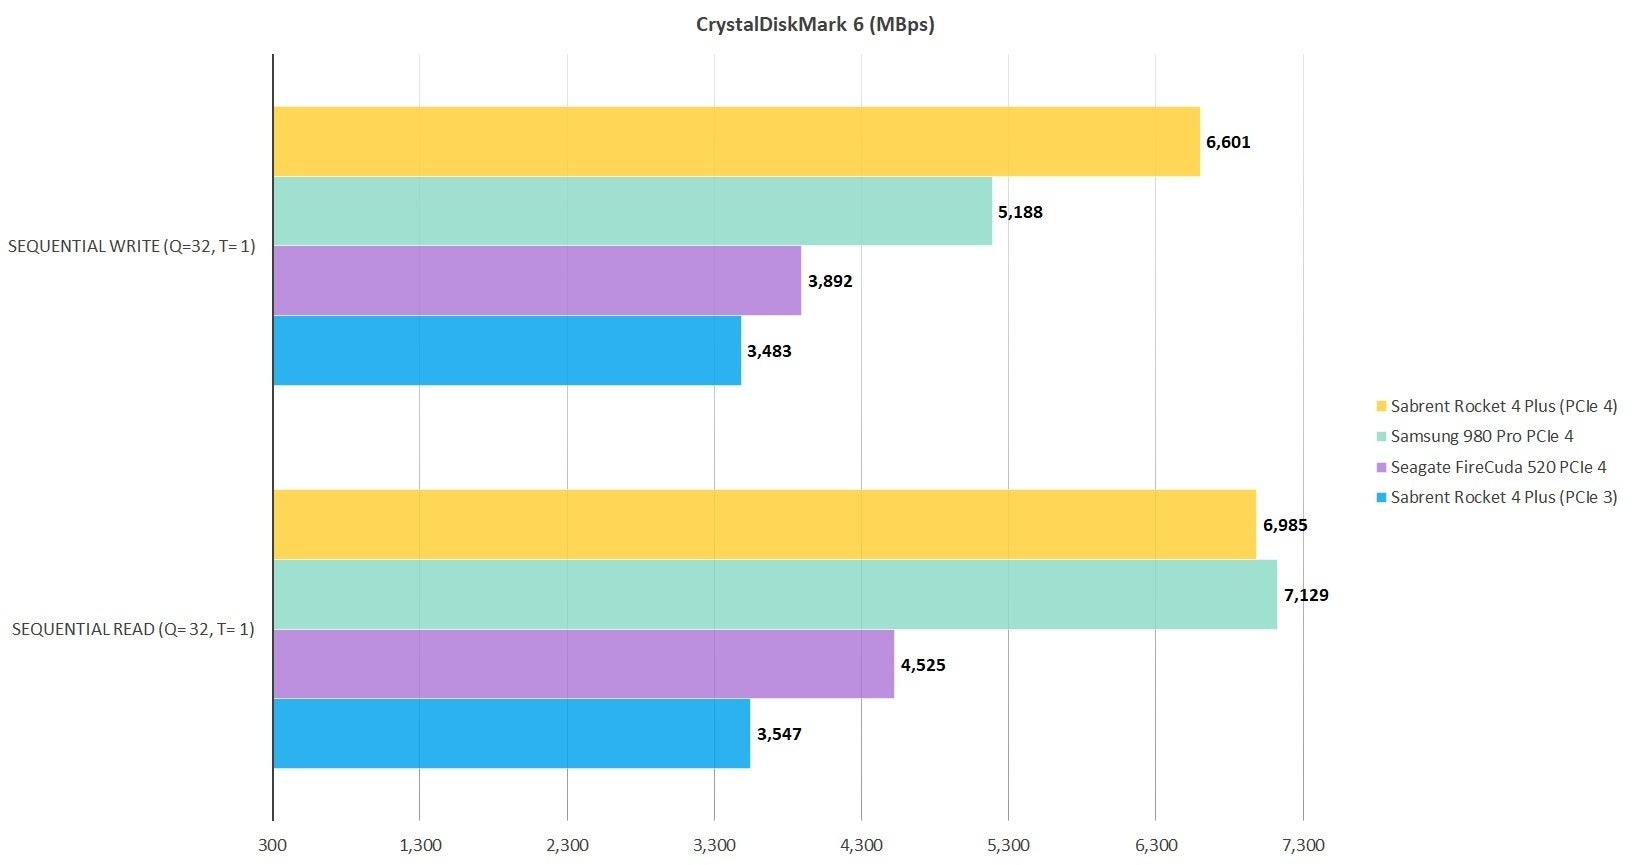
All that coppery goodness would mean nothing if the Rocket 4 Plus didn't haul the freight. The 2TB version I tested delivers. The Rocket 4 Plus's CrystalDiskMark 6 sustained throughput numbers are impressive indeed, trading first place between writing and reading with the Samsung 980 Pro.
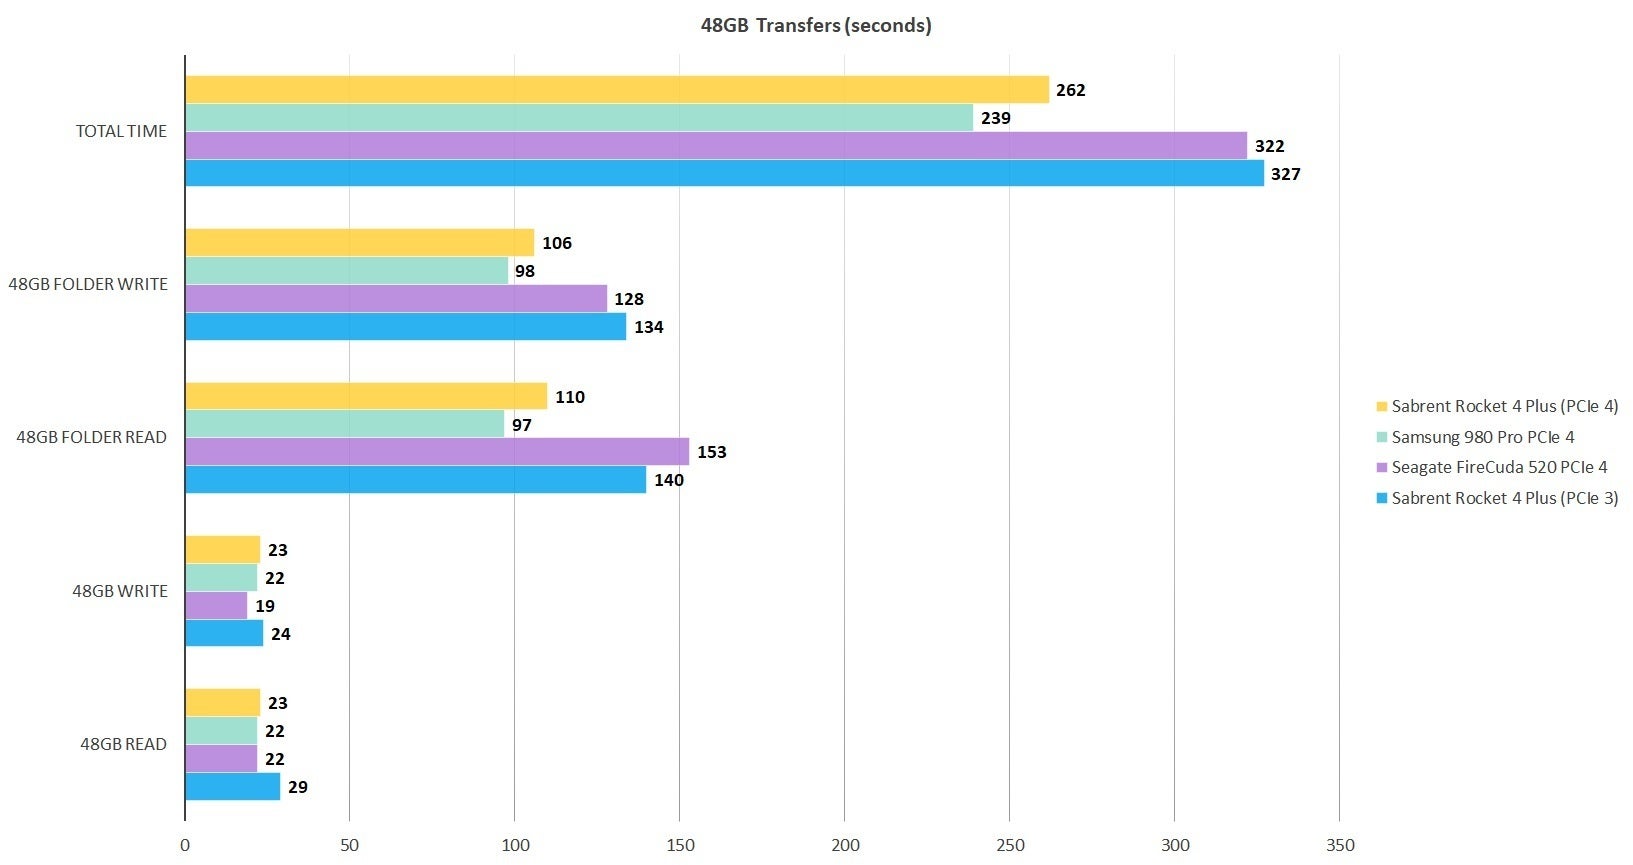
The Rocket 4 Plus couldn't quite match the 980 Pro's overall real world performance in our 48GB transfer tests, but it took a solid second place.
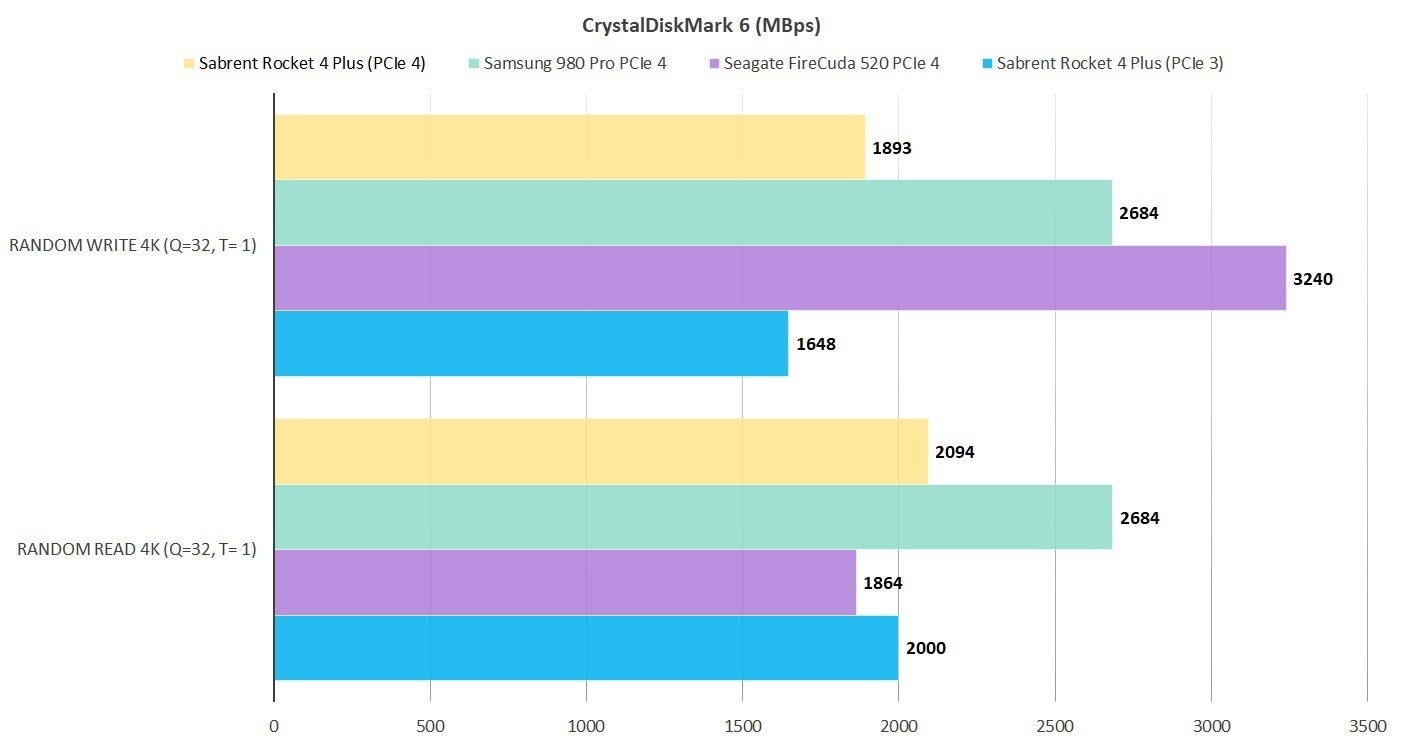
CrystalDiskMark's 4K tests showed another story—the Rocket 4 Plus lagged significantly.
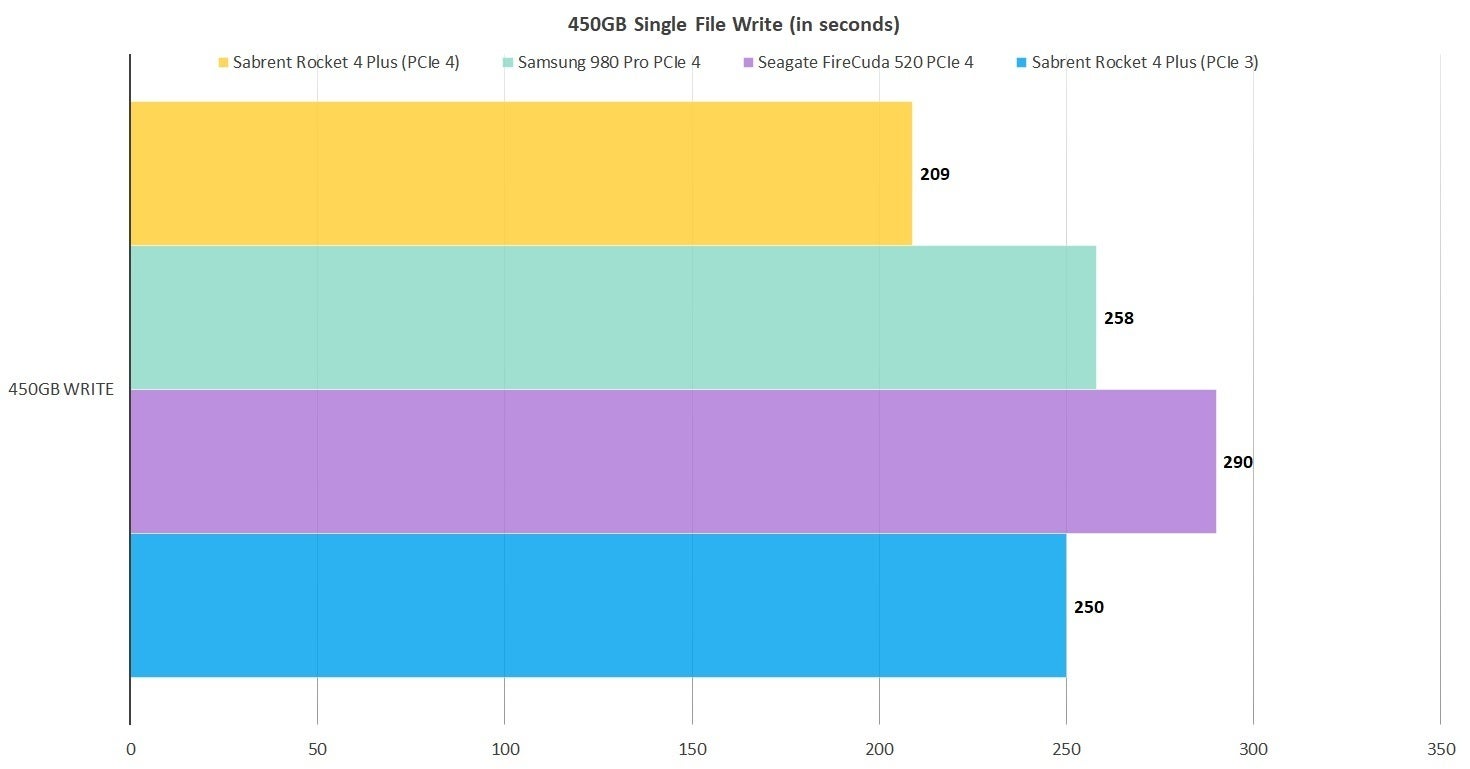
Where the 2TB Rocket 4 Plus really rocked was in our 450GB sustained write tests. Note however, that the 980 Pro Samsung sent me was only a 1TB model. Though it's not shown in the charts, the 1TB version dropped to around 675MBps (PCIe 3) at around the 350GB mark in the copy and took 386 seconds, compared to the 2TB version's 250 seconds on PCIe 3 and 209 seconds over PCIe 4. Yes, cache makes a difference.
I should also mention that in general, it's never a good idea to run an SSD close to capacity. Write speeds will slow down tremendously without NAND available as cache. Always overbuy in terms of capacity.
The PCIe 3 tests utilized Windows 10 64-bit running on a Core i7-5820K/Asus X99 Deluxe system with four 16GB Kingston 2666MHz DDR4 modules, a Zotac (NVidia) GT 710 1GB x2 PCIe graphics card, and an Asmedia ASM2142 USB 3.1 card. It also contains a Gigabyte GC-Alpine Thunderbolt 3 card, and Softperfect Ramdisk 3.4.6 for the 48GB read and write tests.
The PCIe 4 testing was done on an MSI MEG X570 motherboard socketing an AMD Ryzen 7 3700X 8-core CPU, using the same Kingston DRAM, cards, and software. All testing is performed on an empty, or nearly empty drive. Performance will decrease as the drive fills up.
A nice buy at 2TB
Though there's room for improvement in small- and 4K file performance, there's little else to complain about with the Sabrent Rocket 4 Plus in its 2TB incarnation. That it can wrestle at all with the 980 Pro at this price point is a feather in Sabrent's (and Phison's) cap.
Is charging by consumption (usage-based pricing) a superior model for a business? When we say UBP, we mean charging customers by how much they use, rather than a constant amount of seats per month or API calls per month.
On on hand, UBP lubricates the customer conversion funnel. Prospects sign up and grow their accounts seamlessly. Usage data feeds the PLG lead score, and AEs outbound to the most promising users. Customers expand as their needs dictate and customer segments fall out from usage data
On the other hand, customers may be frustrated to estimate how much of a product they’ll use and the surprise of overage charges. Separately, the startup may have to reinvent its GTM: new AE quotas, sales materials, margin calculations.
These three questions may help guide a startup to the best answer:
Is my startup selling an application or infrastructure?
Application software companies sell seats. Infrastructure companies sell API calls, licenses per core or host, SMSs, bandwidth, storage by the GB. Salesforce largely set the standard for selling application seats.
Most of the time, application software companies don’t sell seats via UBP. Slack is a notable exception. Selling constant seat counts stems from the perception that the number of people using software shouldn’t change that much from one month to the next for most software. The predictability of fixed costs outweighs the benefits of flexibility.
Infrastructure usage can vary widely depending on seasonality (retail traffic spikes in Q4), developer activity (migration from one architecture to the next), new product launches, amongst other factors.
Selling UBP to a buyer accustomed to buying a flat seat count introduces more friction into the sales process. Often, the effort probably isn’t worth it, unless the company’s stated strategy is to differentiate on price structure.
What should my unit of pricing be?
The goal of UBP is to align the cost of software with the value. The unit of pricing is the crux to unlocking that puzzle.
The unit must be easy for a customer to understand, simple to predict, and crystal-clear so there aren’t arguments on what a unit is or isn’t in the future.
Company
Product
Unit
Pricing
AppDynamics
APM
CPU Core
$6 / core / month
ScoutAPM
APM
API Call
$1 / API call / month
Lightstep
APM
Service
$85 / service / month
Instana
APM
Host
$75 / host / month
Splunk
APM
Host
$55 / host / month
DataDog
APM
Host
$31 / host / month
Aligning on a particular unit isn’t easy. Within the same space, companies have different takes. Here’s a table of the usage-based pricing schemes of Application Performance Monitoring (APM) companies' that I put together from scanning each business’s pricing page. There are four different units across these six companies.
Having varying units might be an advantage: it’s harder for customers to price discriminate. How many API calls per host or services per host is the same as $31 per host per month?
But it might confuse the customer who’s accustomed /ato buying the service in a different way.
Is your startup differentiating on pricing to compete with an incumbent? Or are selling a superior product at a premium in which case using the same pricing model with higher fees reinforces the brand?
Can this pricing model achieve certain boundary pricing conditions?
How much should a Fortune 500 bank pay for your startup? How about a 50 person SaaS company?
The UBP pricing scheme needs to satisfy these boundary conditions: a certain customer ought to pay a certain amount in order for the business to succeed.
Often, a straight UBP pricing model doesn’t scale into the enterprise. A F500 may not consume enough units to justify a $250k or $2m deal. Introducing pricing layers on the unit of pricing can remedy this challenge. Basic units cost $1. Units that are HIPAA compliant cost 3x as much and FINRA compliant is one dollar more per unit.
Sometimes, companies add a second part to the UBP model: the platform fee, which makes the UBP a 2-part tariff. The platform fee instant boosts the ACV ad can be tailored per customer segment
One other thought on UBP. Some customers fear the sticker shock of dramatic usage in the first billing period. To offset this risk, many sales teams cap the charge in the first billing period to ensure customers who sign up and use substantially more of a service don’t suffer sticker shock when the first bill arrives.
Thanks to Barry McCardel for the inspiration on this post.
Despite the four-month bearish price action, institutions continue to pile drive bitcoin, which might have scared away retail leverage traders. This is because institutions are focusing on longer-term horizons and see the potential for big profits in BTC’s growth over time. The recent large outflow of coins from the U.S.-based crypto exchange Coinbase is evident, according to blockchain analytics firm Glassnode. Related Reading | 82% Of Bitcoin Short-Term Holder Supply Now In Loss, Capitulation Ahead? The recent highly volatile markets have sent bitcoin prices tumbling, with a total of 31,130 bitcoin leaving Coinbase last week. This is the highest single-week outflow since 2017, data tracked by Glassnode. In a weekly newsletter published Monday, Glassnode said; Large outflows like this one are actually part of a consistent trend in the Coinbase balance, which has been stair-stepping downwards over the last two years. As the largest exchange by BTC balance, and a preferred venue for U.S.-based institutions, this further supports the adoption of bitcoin as a macro asset by larger institutions. The crypto markets have experienced drought over the past week. The Nasdaq-listed exchange’s holding in bitcoin has dropped a four-year low of 649,500 BTC for just the second time since 2018. In addition, the amount of bitcoins held by all centralized exchanges has decreased to 2,519,403 BTC, the lowest number since November 2018. Withdrawal Bitcoins Moved To Inactive Wallets The Coinbase withdrawal may be driving up the price of Bitcoin. The declining exchange balance means fewer coins are available for liquidations on exchanges, which could lead to an increase in demand and push prices higher still – especially since those withdrawals have moved into largely inactive wallets. Additionally, Glassnode said; If we look at the Illiquid Supply Shock Ratio (ISSR), we can see a significant uptick this week. Suggesting that these withdrawn coins have been moved into a wallet with little-to-no history of spending. The ISSR is on an upwards trend, suggesting that these withdrawn coins transferred into a wallet with little-to-no history of spending. Related Reading | Bitcoin Detractor Peter Schiff Lays On What Will Trigger Bitcoin Recovery The current amount of supply held in Illiquid wallets is 3.2x larger than Liquid and Highly-Liquid combined. Meaning that many coins are still trapped there despite the recent bear market conditions. A similar metric to what we saw during the 2018 – 2020’s bear market. Major cryptocurrencies registered mostly small losses on Monday. As the European Parliament’s Committee on Economic and Monetary Affairs voted down a bill. That bill could have outlawed proof-of-work in EU territory. The markets were volatile yesterday as investors waited to hear what the Federal Reserve would do with today’s policy meeting. The NASDAQ100 fell 2%, while SPX500 Index dropped 0.75%. DJ30 closed flat following these declines in stock prices. The crypto market experienced a mild correction, with Ethereum, BNB, Solana, and XRP losing 2%. Bitcoin also fell slightly 1.6% in value and trading under $40,000 at the time of writing. Featured image from Flickr, chart from Tradingview.com
The London Assembly Environment Committee has published a report on waste management in the capital and the need to move to a circular economy. Advance publicity for ‘Too Good to Waste’ (released on 16 March) highlights London’s laggard status as a recycler and its over-reliance on incineration. Only 33 per cent of London’s local authority-collected […]
Ethereum (ETH) price rallied almost 8% from its support level near $2500 in the last 2 days. While continuing its volatile price movement in the last 24-hour, the current price is still 4% up near $2650. Although the price action is flat, Santiment data suggest a bullish outlook in the future. According to on-chain metrics
First launching on PlayStation 4 and Xbox One consoles, Assassin's Creed: The Ezio Collection finally arrives on Nintendo Switch. Bundling AC2, Brotherhood and Revelations, we should be getting a good experience here: after all, we've already seen later, more advanced series entries on Nintendo's hybrid in the form of AC3, Black Flag and Rogue. Low quality, compressed audio marred these ports, along with a bunch of bugs in AC3 - so has Ubisoft learned from its mistakes or are these early Assassin's Creed titles best enjoyed elsewhere?
In theory, these games should be a good fit for Switch. The open world action-adventure games are full of small tasks and missions suitable for short play sessions. Plus, early instalments have technical roots on the seventh generation of consoles, which the Switch has proven more than capable of matching, especially as we're looking at earlier titles in the series. There's a clear visual progression: Assassin's Creed 2 is a reasonable enough looking mid-generation effort, but with clear flaws. Facial modelling and animation is awkward, and environmental detail is limited, with flat and plain looking buildings. Brotherhood shows some moderate improvements, particularly in character faces, but is otherwise similar.
Antenna maker Kymeta said March 15 it has raised $84 million to expand manufacturing facilities ahead of deploying its first flat panel, electronically steered user terminals for low Earth orbit (LEO) satellites this year.
The war trades around Ukraine continue to unwind today. Gold nearly hit an all-time high on March 8 but came just shy and it's been a swift retreat since. It's down $43 today and is now flat on the month at $1908.
The summer 2021 highs along with $1900 could act as short-term support but it will be