- Gold follows the general commodity pack lower on Monday.
- Traders weigh US economic data with Fedspeak to model future interest rates in the US, a key driver for Gold.
- XAU/USD continues forming a bearish Head-and-Shoulders pattern on the daily chart.
Gold (XAU/USD) trades marginally lower in the $2,310s on Monday, as possibility that US interest rates might remain high for the foreseeable future weighs on the precious metal.
At their policy meeting last Wednesday, US Federal Reserve (Fed) officials expressed reluctance to signal future cuts to interest rates due to persistent inflation. This, in turn, keeps the opportunity cost of owning non-yielding Gold high, and strengthens the US Dollar, in which Gold is priced.
Gold trades marginally lower amid weak data, a cautious Fed
Gold trades down about half a percent on Monday, exchanging hands in a familiar range as traders weigh up the evidence regarding the future trajectory of US interest rates, a key factor in evaluating the Gold price.
The release of US Producer Price Index (PPI) data on Thursday, the market’s gauge of “factory gate” price growth, provided evidence of a reduction in inflationary pressures, suggesting a higher probability the Federal Reserve (Fed) could move to cut interest rates in the near-term – a positive for Gold.
Yet the Fed itself revised down – from three to one – the number of interest-rate cuts it foresaw making in 2024, at its meeting on Wednesday. Additionally, Fed Chairman Jerome Powell dismissed the importance of the cooler-than-expected Consumer Price Index (CPI) data, released only a few hours earlier, saying it was only one data point, and endorsing a data-dependent approach going forward.
Gold price rose over half a percent to a peak of $2,342 after the disinflationary CPI release, before backtracking on the Fed’s more cautious stance.
On Friday, the Michigan Consumer Sentiment Index declined for the third straight month in a row to 65.6 in June, from 69.1 in May and well below forecasts of 72, preliminary estimates showed. Year-ahead inflation expectations remained unchanged at 3.3%, but the five-year one edged up to 3.1% from 3.0% in May, according to data from the University of Michigan. The overall takeaway from the data seemed to be that it reflected a slowdown in the economy with marginally bullish connotations for Gold.
Gold met pressure following the release of Gold reserves data from The People’s Bank of China (PBoC) last week. The data revealed that the PBoC stopped buying the precious metal between the end of April and May. It was the first time in 18 months the PBoC had not increased its Gold reserves. The inference was that Gold might be overpriced in their view. At the same, analysts at Citibank point to continued strong demand from consumers in China, which, they say, could contribute to a rise in Gold during 2024.
Technical Analysis: Gold forms Head-and-Shoulders top
Gold is still forming what looks like a bearish Head-and-Shoulders (H&S) price pattern. These patterns tend to occur at market tops and signal a change of trend.
XAU/USD Daily Chart
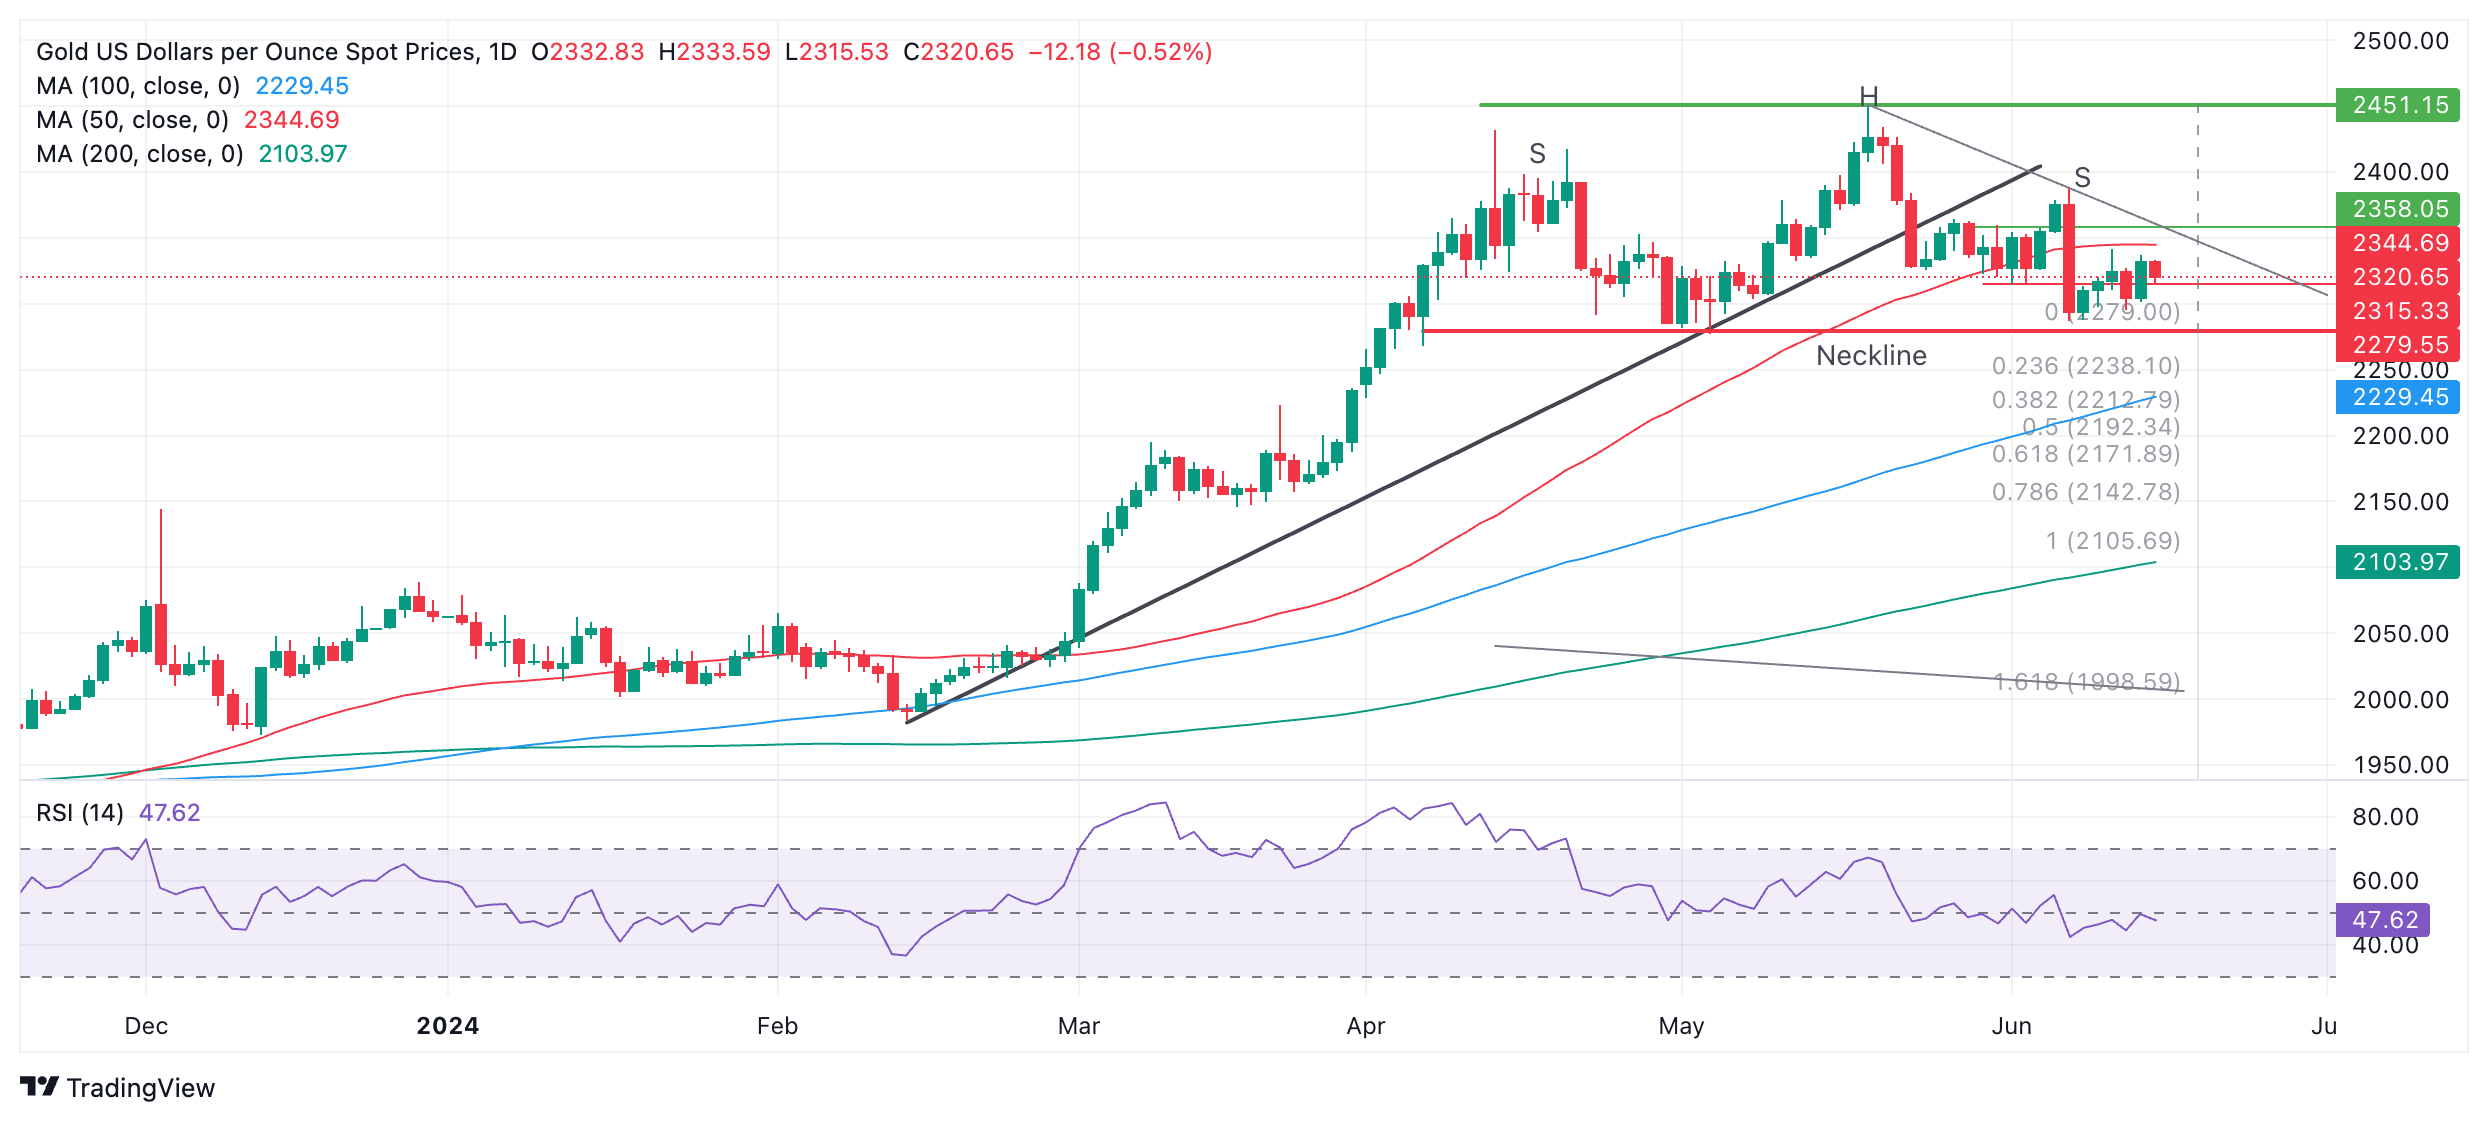
The H&S on Gold has completed a left and right shoulder (labeled “S”) and a “head” (labeled “H”). The so-called “neckline” of the pattern appears to be at the $2,279 support level (red line).
Declining momentum signaled by the Relative Strength Index (RSI) during its development corroborates the pattern.
A decisive break below the neckline would validate the H&S pattern and activate downside targets. The first more conservative target would be $2,171, calculated by taking the 0.618 Fibonacci ratio of the height of the pattern and extrapolating it lower from the neckline. The second target would be at $2,106, the full height of the pattern extrapolated lower.
A break above $2,345, however, would bring the H&S into doubt and could signal a continuation higher, to an initial target at the $2,450 peak.
Gold FAQs
Gold has played a key role in human’s history as it has been widely used as a store of value and medium of exchange. Currently, apart from its shine and usage for jewelry, the precious metal is widely seen as a safe-haven asset, meaning that it is considered a good investment during turbulent times. Gold is also widely seen as a hedge against inflation and against depreciating currencies as it doesn’t rely on any specific issuer or government.
Central banks are the biggest Gold holders. In their aim to support their currencies in turbulent times, central banks tend to diversify their reserves and buy Gold to improve the perceived strength of the economy and the currency. High Gold reserves can be a source of trust for a country’s solvency. Central banks added 1,136 tonnes of Gold worth around $70 billion to their reserves in 2022, according to data from the World Gold Council. This is the highest yearly purchase since records began. Central banks from emerging economies such as China, India and Turkey are quickly increasing their Gold reserves.
Gold has an inverse correlation with the US Dollar and US Treasuries, which are both major reserve and safe-haven assets. When the Dollar depreciates, Gold tends to rise, enabling investors and central banks to diversify their assets in turbulent times. Gold is also inversely correlated with risk assets. A rally in the stock market tends to weaken Gold price, while sell-offs in riskier markets tend to favor the precious metal.
The price can move due to a wide range of factors. Geopolitical instability or fears of a deep recession can quickly make Gold price escalate due to its safe-haven status. As a yield-less asset, Gold tends to rise with lower interest rates, while higher cost of money usually weighs down on the yellow metal. Still, most moves depend on how the US Dollar (USD) behaves as the asset is priced in dollars (XAU/USD). A strong Dollar tends to keep the price of Gold controlled, whereas a weaker Dollar is likely to push Gold prices up.
- SEO Powered Content & PR Distribution. Get Amplified Today.
- PlatoData.Network Vertical Generative Ai. Empower Yourself. Access Here.
- PlatoAiStream. Web3 Intelligence. Knowledge Amplified. Access Here.
- PlatoESG. Carbon, CleanTech, Energy, Environment, Solar, Waste Management. Access Here.
- PlatoHealth. Biotech and Clinical Trials Intelligence. Access Here.
- Source: https://www.fxstreet.com/news/gold-tracks-other-commodities-lower-202406171051

