- Fed policymakers agreed that inflation was under control.
- US job openings and initial jobless claims fell.
- Private employment and nonfarm payrolls rose, strengthening the dollar.
The GBP/USD weekly forecast is slightly bearish as the robust US labor market’s strength means a potential delay in the Fed’s rate-cut plans. Consequently, it challenges the earlier March anticipation.
–Are you interested in learning more about MT5 brokers? Check our detailed guide-
Ups and downs of GBP/USD
The pound had a slightly bearish week where the price fluctuated amid high-impact data from the US. The week started with minutes from the Fed’s December meeting. At the meeting, policymakers agreed that inflation was under control.
Additionally, a series of employment reports from the US showed a robust labor market. Job openings and initial jobless claims fell. Meanwhile, private employment and nonfarm payrolls rose, strengthening the dollar against most major currencies.
Next week’s key events for GBP/USD


Next week, the US will release the crucial figures showing consumer and producer inflation. Meanwhile, the UK will release data on manufacturing production and the gross domestic product.
After a strong employment report from the US on Friday, all focus will be on the inflation report. Notably, Richmond Fed President Thomas Barkin stated that robust US job growth and a low unemployment rate indicate that the Federal Reserve hasn’t reached a stage where its attempts to manage inflation pose a direct tradeoff with its goal of sustaining maximum employment.
Therefore, if inflation is still high, it could mean higher rates for longer. On the other hand, if inflation falls, the Fed will likely continue with its plan to cut rates this year.
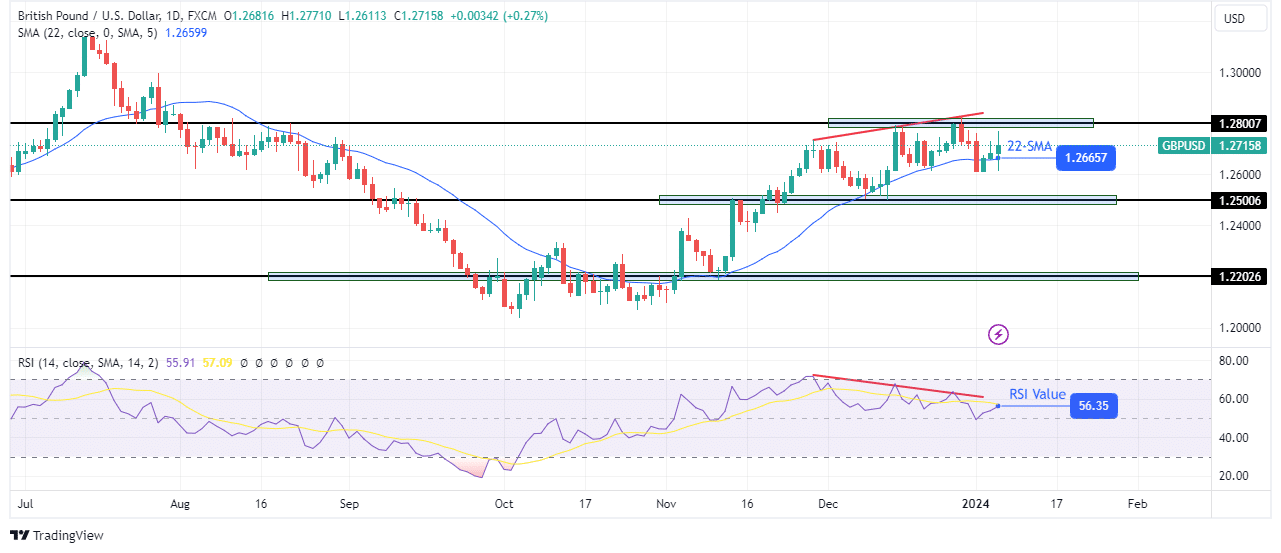
GBP/USD weekly technical forecast: Bullish momentum fades near the 1.2800 resistance

The pound is bullish on the charts, and the price has risen to the 1.2800 resistance level. However, the bullish move has become shallower, with the price sticking close to the 22-SMA. At the same time, the slope of the SMA is not as steep as when bulls took over. These are all signs that bulls have weakened. Additionally, the RSI has made a bearish divergence, moving lower as the price makes new highs. This indicates weaker bullish momentum.
–Are you interested in learning more about forex signals telegram groups? Check our detailed guide-
Currently, the price trades with the nearest resistance at 1.2800 and the nearest support at 1.2500. Therefore, if bears take over, the price will likely retest the 1.2500 support. Meanwhile, bears could target lower support levels like 1.2202 if the divergence leads to a reversal.
Looking to trade forex now? Invest at eToro!
68% of retail investor accounts lose money when trading CFDs with this provider. You should consider whether you can afford to take the high risk of losing your money
- SEO Powered Content & PR Distribution. Get Amplified Today.
- PlatoData.Network Vertical Generative Ai. Empower Yourself. Access Here.
- PlatoAiStream. Web3 Intelligence. Knowledge Amplified. Access Here.
- PlatoESG. Carbon, CleanTech, Energy, Environment, Solar, Waste Management. Access Here.
- PlatoHealth. Biotech and Clinical Trials Intelligence. Access Here.
- Source: https://www.forexcrunch.com/blog/2024/01/06/gbp-usd-weekly-forecast-strong-nfp-pours-water-on-rate-cuts/


