- UK data revealed a significant jump in monthly unemployment claims.
- US data revealed a smaller-than-expected figure for consumer inflation in May.
- Fed forecasts at the FOMC meeting showed only one rate cut in December.
The GBP/USD weekly forecast shows more downside potential as Fed forecasts for rate cuts overshadow the recent cooler inflation figures.
Ups and downs of GBP/USD
The pound had a bearish week amid a range of economic reports from the US and the UK. At the start of the week, UK data revealed a significant jump in monthly unemployment claims, showing a decline in the labor market that weighed on the pound.
–Are you interested in learning more about Bitcoin price prediction? Check our detailed guide-
However, the move later reversed when US data revealed a smaller-than-expected figure for consumer inflation in May. Investors raised bets for a Fed rate cut in September, pushing the dollar lower. Unfortunately, Fed forecasts at the FOMC meeting showed only one rate cut in December, which helped the dollar recover as the week ended. This recovery continued despite softer-than-expected wholesale inflation data.
Next week’s key events for GBP/USD
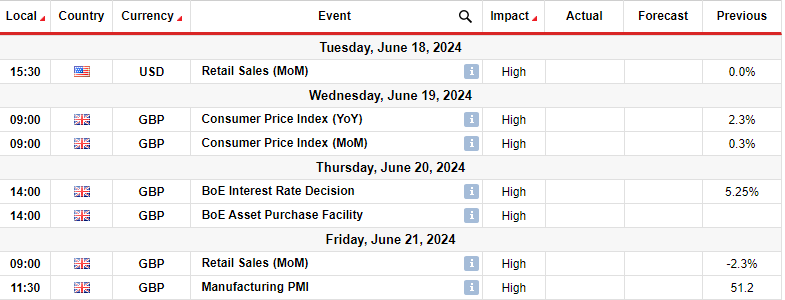
Next week, the UK will release several major reports, including the CPI, retail sales, and manufacturing PMI. At the same time, investors will pay attention to Thursday’s Bank of England policy meeting. Meanwhile, the US will only release its retail sales report.
The UK consumer inflation report will significantly shape the outlook for interest rates. Inflation in the country has been on a downtrend and is currently at 2.3%, near the central bank’s target. However, in the last report, economists had expected it to reach 2.1%. Another bigger-than-expected figure would lower bets for a cut in August.
Meanwhile, the Bank of England will likely maintain rates at its policy meeting.
GBP/USD weekly technical forecast: Break below 22-SMA triggers shift in sentiment

On the technical side, the GBP/USD price has broken below the 22-SMA after failing to breach the 1.2800 critical resistance level. At the same time, the RSI has broken below 50, signaling a shift in sentiment to bearish.
–Are you interested in learning more about forex basics? Check our detailed guide-
The previous bullish move paused at 1.2800, and bears started showing strength with large candles. The shift in sentiment will allow them to revisit the 1.2600 support level. If bears can break below this level to start making lower highs and lows, they will confirm a new downtrend. Moreover, the decline might continue to the 1.2400 key level.
Looking to trade forex now? Invest at eToro!
68% of retail investor accounts lose money when trading CFDs with this provider. You should consider whether you can afford to take the high risk of losing your money.
- SEO Powered Content & PR Distribution. Get Amplified Today.
- PlatoData.Network Vertical Generative Ai. Empower Yourself. Access Here.
- PlatoAiStream. Web3 Intelligence. Knowledge Amplified. Access Here.
- PlatoESG. Carbon, CleanTech, Energy, Environment, Solar, Waste Management. Access Here.
- PlatoHealth. Biotech and Clinical Trials Intelligence. Access Here.
- Source: https://www.forexcrunch.com/blog/2024/06/15/gbp-usd-weekly-forecast-fed-rate-forecasts-pushes-dollar-up/

