Join Our Telegram channel to stay up to date on breaking news coverage
The Fantom price prediction shows that FTM has been gaining 6.01% in the last 24 hours to touch the daily high of $0.34.
Fantom Prediction Statistics Data:
- Fantom price now – $0.33
- Fantom market cap – $933.3 million
- Fantom circulating supply – 2.8 billion
- Fantom total supply – 3.1 billion
- Fantom CoinMarketCap ranking – #55
FTM/USD Market
Key Levels:
Resistance levels: $0.40, $0.45, $0.50
Support levels: $0.25, $0.20, $0.15
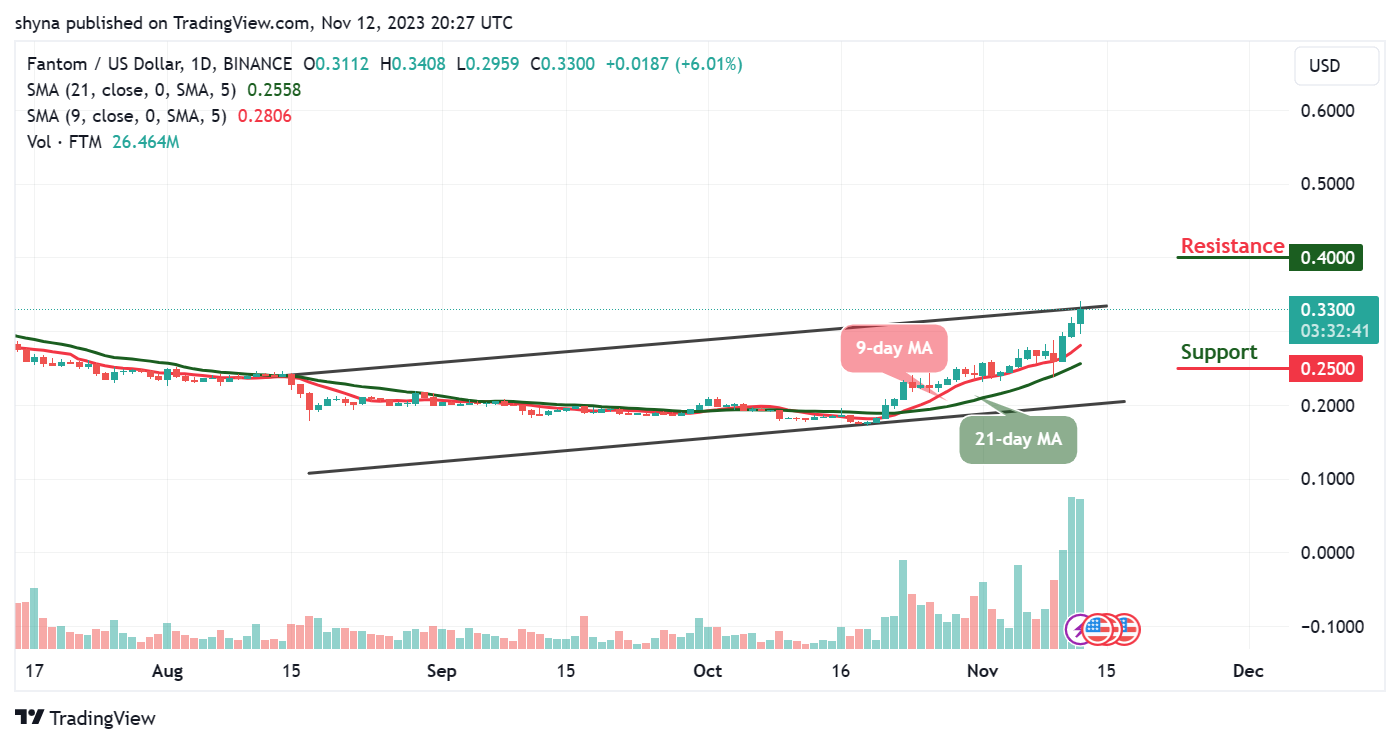
FTM/USD has been exhibiting strength since the past few days aiming to cross above the upper boundary of the channel amid technical correction from the downward trend. At the moment, the coin is recovering toward a resistance level of $0.35. However, if the red line of the 9-day MA remains above the green line of the 21-day MA, the Fantom price may continue the bullish movement.
Fantom Price Prediction: FTM Finally Making a Bounce?
The Fantom price keeps moving to the north. Moreover, though the current price of Fantom at $0.33 is above the 9-day and 21-day moving averages within the channel, the recovery seems to have begun as the coin moves to cross above the channel. The Fantom (FTM) needs to continue its up-trending growth in the coming days to recover properly. As per the current trend, the next resistance levels are likely to come at $0.40, $0.45, and $0.50.
On the downside, a sustainable move below the moving averages could open the bearish way to a $0.27 support level and this barrier may likely slow down the bears and then serve as a jumping-off ground for the recovery. Meanwhile, the next support levels could be located at $0.25, $0.20, and $0.15 respectively.
FTM/BTC Trades Bullishly
Against Bitcoin, the Fantom price continues to trend bullishly as the resistance further outweighs the support. However, there is a need for an increasing volume and resistance to cause an upsurge in the market which could make the coin cross above the upper boundary of the channel and move toward the resistance level of 1020 SAT and above.
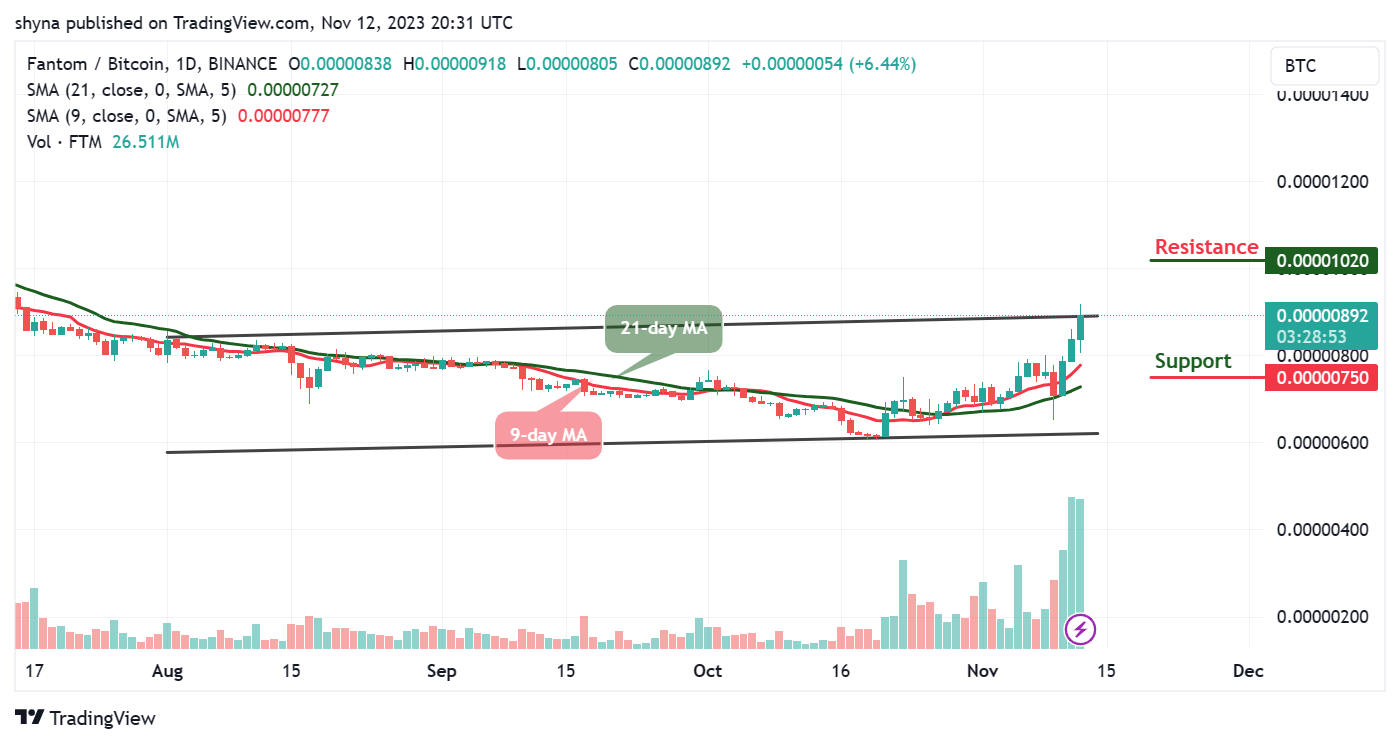
However, there’s no sign of a bearish movement in the market at the moment. Therefore, if a bearish move occurs and brings the coin below the 9-day and 21-day moving averages, FTM/BTC may hit the nearest support at 750 SAT and below but the 9-day MA is seen moving above the 21-day MA to increase the bullish movement.
Fantom Alternatives
As of the current moment, the Fantom price is undergoing a significant upward movement, currently trading at $0.33. This positive trend is reinforced by a bullish crossover above both the 9-day and 21-day moving averages. Looking ahead, if Fantom continues its positive momentum, there’s a likelihood of it surpassing the upper boundary of the channel. However, it’s important to note that this upward trajectory might encounter heightened resistance at that point.
In comparing Fantom (FTM) and the emerging token Bitcoin Minetrix, Fantom offers stability with its established market cap of $933 million but may have limited short-term growth potential. On the other hand, Bitcoin Minetrix, currently raising close to $3.9 million in its presale, has a low market cap, suggesting the possibility of significant rapid gains. Investors are encouraged to consider diversifying their portfolio by exploring the potential growth presented by Bitcoin Minetrix.
New Crypto Mining Platform – Bitcoin Minetrix

- Audited By Coinsult
- Decentralized, Secure Cloud Mining
- Earn Free Bitcoin Daily
- Native Token On Presale Now – BTCMTX
- Staking Rewards – Over 100% APY
Join Our Telegram channel to stay up to date on breaking news coverage
- SEO Powered Content & PR Distribution. Get Amplified Today.
- PlatoData.Network Vertical Generative Ai. Empower Yourself. Access Here.
- PlatoAiStream. Web3 Intelligence. Knowledge Amplified. Access Here.
- PlatoESG. Carbon, CleanTech, Energy, Environment, Solar, Waste Management. Access Here.
- PlatoHealth. Biotech and Clinical Trials Intelligence. Access Here.
- Source: https://insidebitcoins.com/news/fantom-price-prediction-for-today-november-12-ftm-technical-analysis

