Ethereum price is finding bids above the $1,720 zone against the US Dollar. ETH could start a decent recovery if there is a move above the $1,770 resistance.
- Ethereum is struggling below the $1,770 and $1,780 resistance levels.
- The price is trading below $1,770 and the 100-hourly Simple Moving Average.
- There was a break above a short-term contracting triangle with resistance near $1,740 on the hourly chart of ETH/USD (data feed via Kraken).
- The pair could recover if there is a move above the $1,770 and $1,780 levels.
Ethereum Price Holds Support
Ethereum’s price remained well-bid above the $1,720 support zone. ETH seems to be forming a base above the $1,720 level, similar to Bitcoin. A low is formed near $1,718 and the price is slowly moving higher.
There was a move above the $1,740 level. Besides, there was a break above a short-term contracting triangle with resistance near $1,740 on the hourly chart of ETH/USD. The pair is now struggling to settle above the 23.6% Fib retracement level of the key decline from the $1,855 swing high to the $1,718 low.
Ether is still trading below $1,770 and the 100-hourly Simple Moving Average. Immediate resistance is near the $1,760 zone and the 100-hourly Simple Moving Average. The next major resistance is near the $1,770 level. The first major resistance is near $1,780 or the 50% Fib retracement level of the key decline from the $1,855 swing high to the $1,718 low.
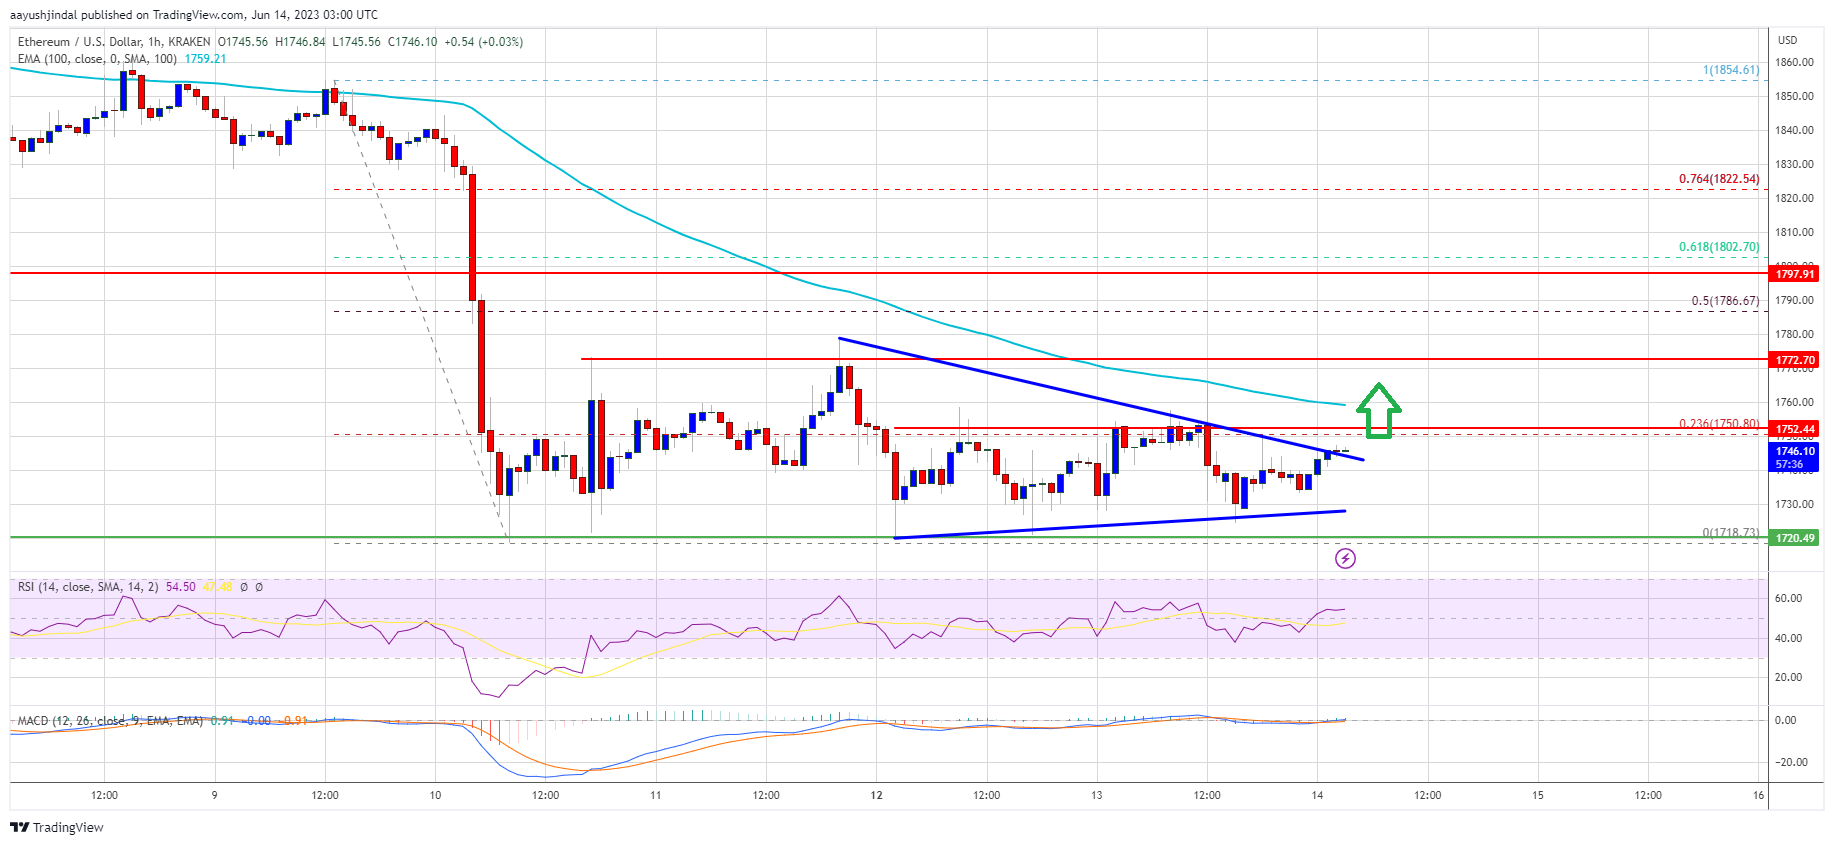
Source: ETHUSD on TradingView.com
A proper move above the $1,770 and $1,780 resistance levels might send Ether toward $1,850. The next resistance sits near $1,880, above which Ethereum could rise toward the $1,920 level. Any more gains above the $1,920 resistance zone might send the price toward the $2,040 resistance.
Fresh Decline in ETH?
If Ethereum fails to clear the $1,780 resistance, it could start another decline. Initial support on the downside is near the $1,730 level and the triangle trend line.
The next major support is near the $1,720 level. If there is a break and close below the $1,720 support, the price could start a major decline toward the $1,640 support. Any more losses may perhaps send the price toward the $1,600 zone.
Technical Indicators
Hourly MACD – The MACD for ETH/USD is losing momentum in the bearish zone.
Hourly RSI – The RSI for ETH/USD is now above the 50 level.
Major Support Level – $1,720
Major Resistance Level – $1,780
- SEO Powered Content & PR Distribution. Get Amplified Today.
- EVM Finance. Unified Interface for Decentralized Finance. Access Here.
- Quantum Media Group. IR/PR Amplified. Access Here.
- PlatoAiStream. Web3 Data Intelligence. Knowledge Amplified. Access Here.
- Source: https://www.newsbtc.com/analysis/eth/ethereum-price-recovery-1780/

