The Cardano price is moving sideways after losing steam over the past few trading sessions. Over the last 24 hours, ADA lost 0.7% of its value, meaning the coin was trading in a rangebound manner. The past week, however, was quite bullish for the altcoin, as it gained nearly 11%.
The technical outlook of ADA has continued to suggest that the bulls are still around as demand and accumulation on the daily chart remain positive. As Bitcoin faced rejection at the $25,000 price, many altcoins stopped moving upward and have been trading under their immediate price resistance mark.
Cardano has been oscillating between the $0.38 and $0.40 price levels. If the altcoin doesn’t gather another push from the buyers, it may soon lose its current price level.
The chances of ADA showing a recovery in the following trading sessions are slim but not nil. ADA is currently trading 86% below its all-time high set in 2021.
Cardano Price Analysis: One-Day Chart
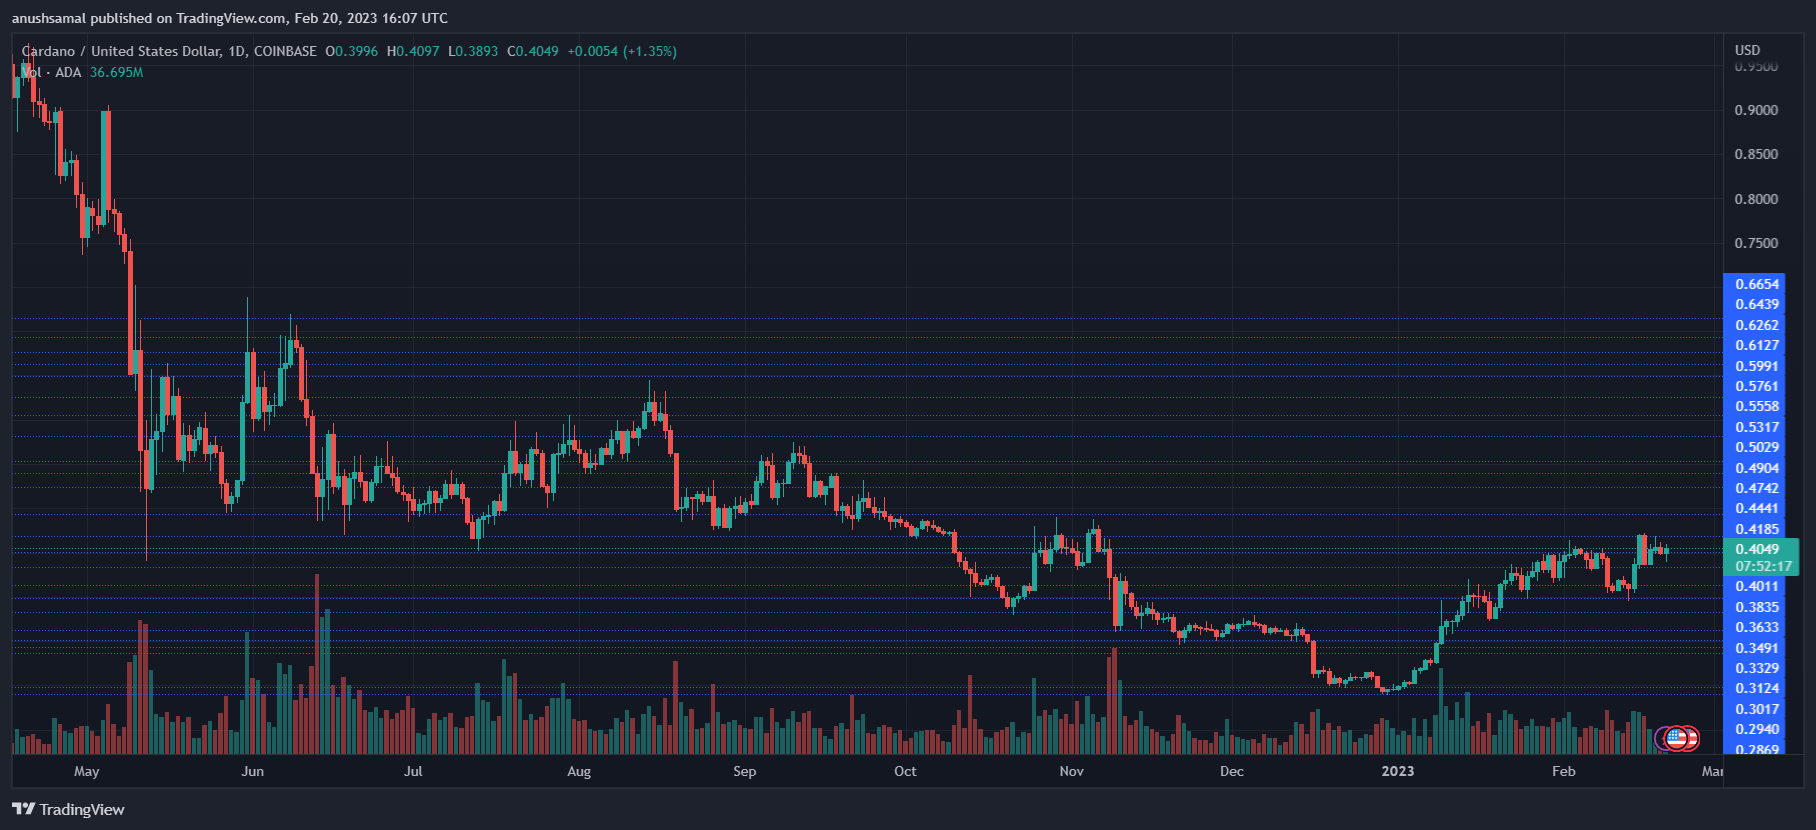
ADA recently broke through several key resistance levels, including the $0.38 price. After it surpassed the $0.38 mark, the coin went up to the $0.41 mark, where the bulls could not defend that price level. ADA was trading at $0.409 at the time of writing.
Currently, the immediate resistance level for Cardano stands at $0.41, but $0.42 will act as a more challenging price ceiling. Clearing the $0.42 price mark can propel ADA to $0.44. Conversely, rejection at the $0.40 mark will drag ADA to $0.38. The amount of Cardano traded in the last session was green, indicating a bullish time frame.
Technical Analysis
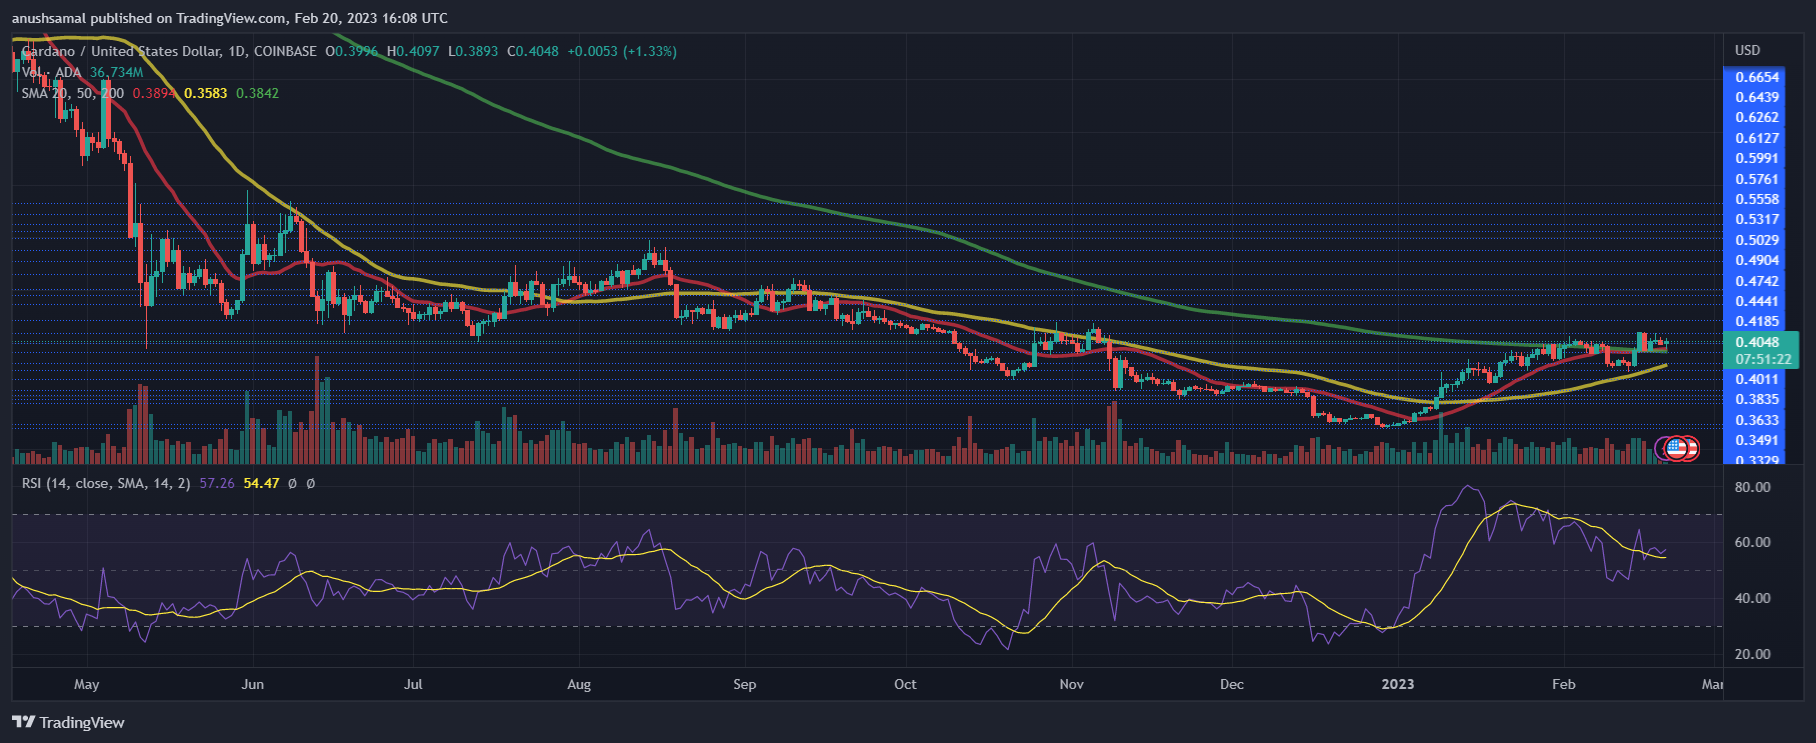
ADA had visited the overbought zone after it broke past the $0.38 price level, but after that, it retraced from that zone. At press time, however, Cardano again registered an uptick in demand.
The Relative Strength Index was moving close to the 60-mark, which meant that buyers were more in number than sellers in the market.
Similarly, the Cardano price was above the 20-Simple Moving Average line (SMA) as buyers were driving the price momentum in the market. Additionally, ADA was above the 200-SMA line, indicating increased bullishness and a rise in price over the next trading session.
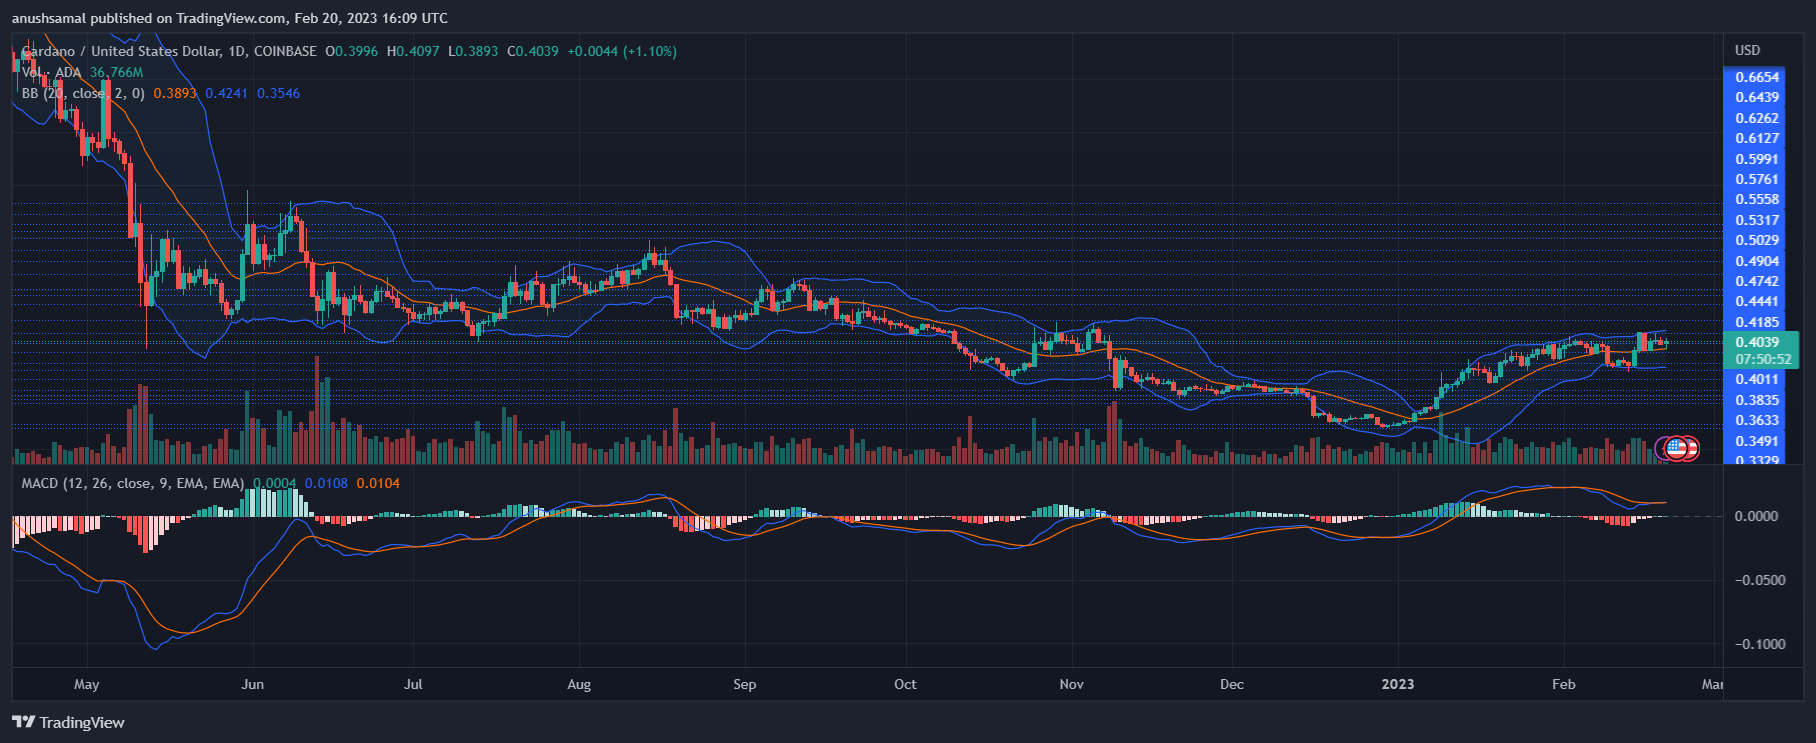
Following the other indicators, ADA displayed buy signals on the one-day chart. The Moving Average Convergence Divergence indicates price momentum and trend reversals. The hand started to form green signal bars, which meant buy signals for the altcoin.
This could imply that ADA provided traders with a buying opportunity, as the price could rise in the next trading session.
The Bollinger Bands display price volatility and fluctuation. The bands were parallel, signifying that Cardano might stick to trading sideways even if the price rose.
Featured Image From UnSplash, Charts From TradingView.com.
- SEO Powered Content & PR Distribution. Get Amplified Today.
- Platoblockchain. Web3 Metaverse Intelligence. Knowledge Amplified. Access Here.
- Source: https://www.newsbtc.com/news/cardano/cardano-to-continue-consolidating-unless-it-clears-this-crucial-level/

