After losing the crucial $0.34 price support, Cardano (ADA) has experienced a significant downtrend. In the past 24 hours, ADA has declined by 1.6%. On the weekly chart, ADA has struggled to recover from an over 8% depreciation.
The technical outlook indicates that bears have control of the price, with low demand and accumulation. Although ADA has started rebounding from the $0.20 level, a strong bullish influence has yet to be observed.
If buying strength does not recover in the upcoming trading sessions, ADA may break below its immediate support line. The volatility of Bitcoin makes it challenging for other altcoins to stabilize their prices.
Related Reading: Bitcoin Whales Continue To Accumulate As BTC Makes Recovery Push
ADA’s potential to reach the $0.30 level depends on consistent demand and support from the broader market. However, even if these conditions are met, ADA may encounter strong resistance at the $0.30 price mark. The decrease in market capitalization suggests that sellers are currently dominating the ADA market.
Cardano Price Analysis: One-Day Chart

As of the time of writing, ADA was trading at $0.25. Since being rejected at the $0.30 level, ADA has lost several support lines. The coin currently faces overhead resistance at $0.27, and if it manages to breach this level, it may aim for a target of $0.29.
If buying strength does not recover, ADA is expected to experience a consolidation phase within the range of $0.22 to $0.28 before attempting a breakout.
The local support level is currently situated at $0.22. In the event of a fall from $0.22, the price may further decline to $0.20. The trading volume of ADA in the last session has declined, indicating a decrease in buying strength and overall market activity.
Technical Analysis
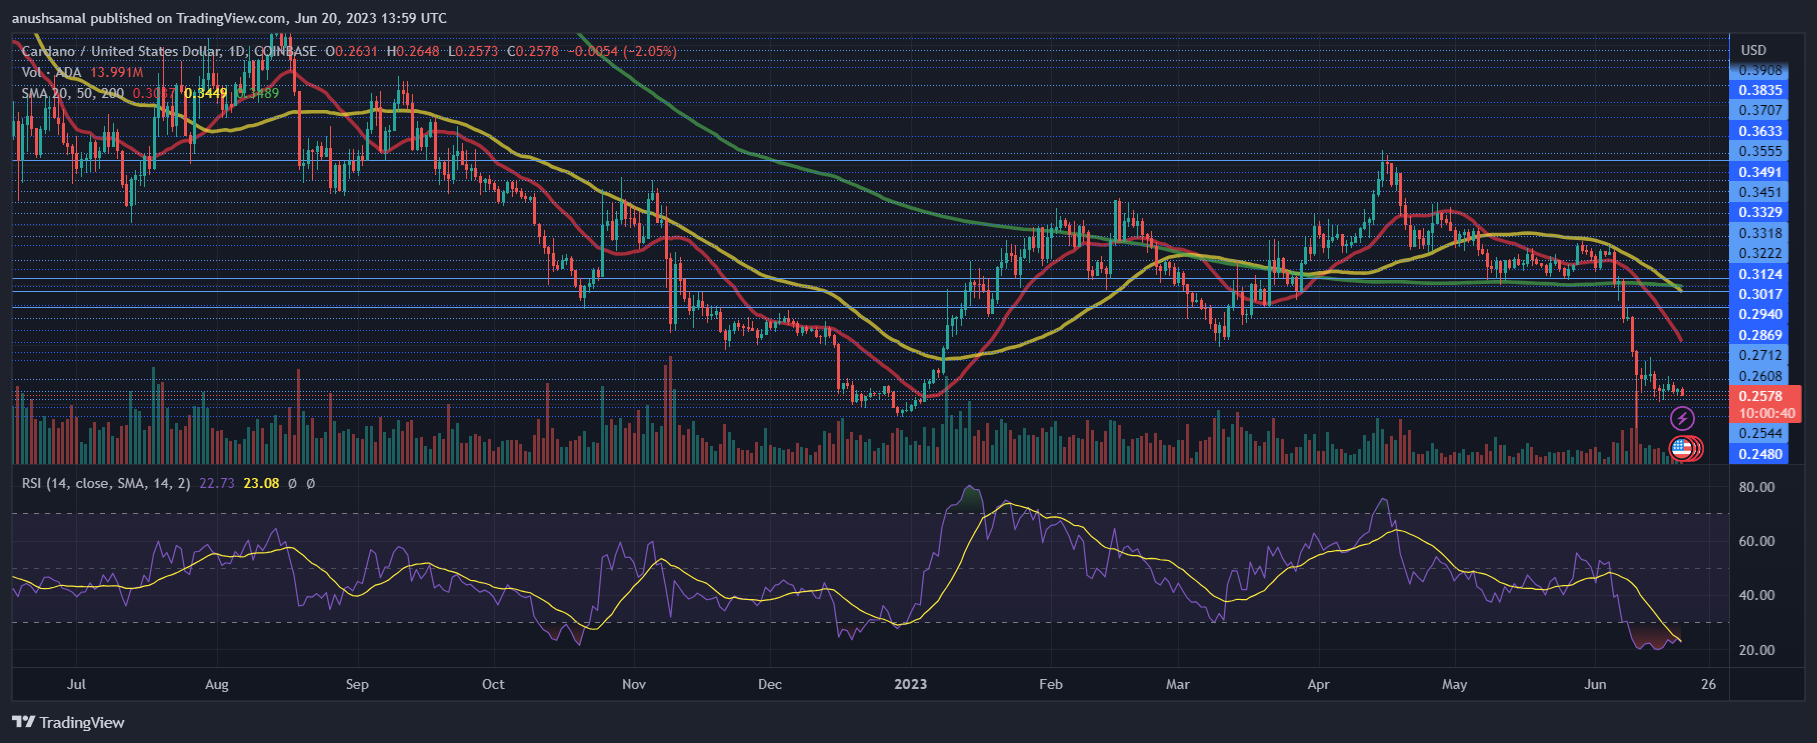
At the time of writing, ADA has struggled to regain investor confidence and show signs of recovery. The Relative Strength Index (RSI) has dipped below the 30-mark, indicating an oversold condition. This suggests that selling pressure persists and investor sentiment remains weak.
Additionally, the ADA price has moved below the 20-Simple Moving Average (SMA) line, highlighting low demand and indicating that sellers are currently driving the price momentum.
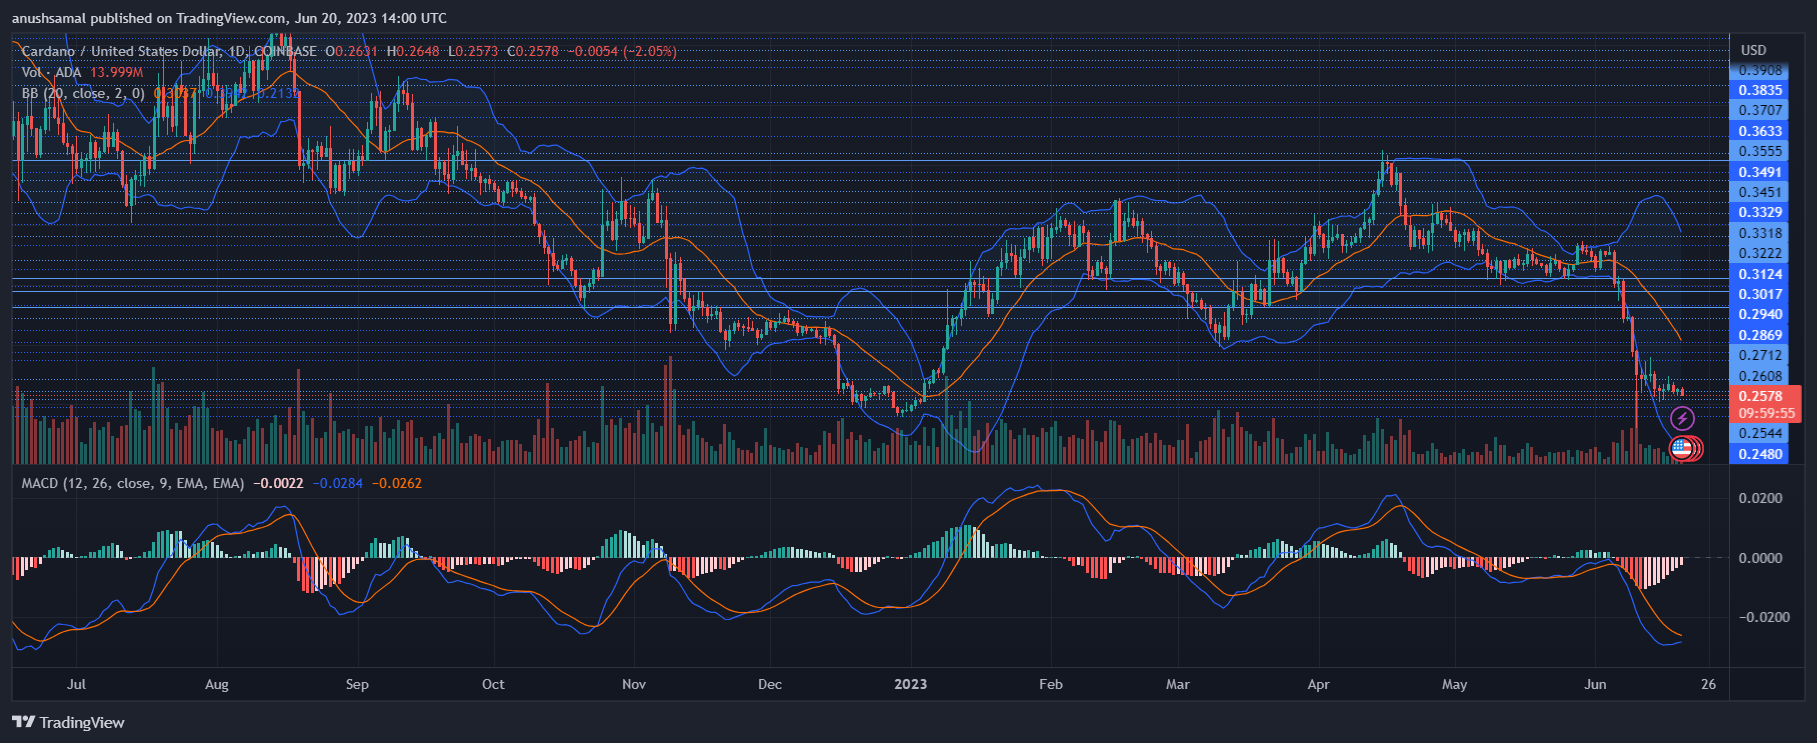
In terms of demand, another significant indicator has generated sell signals on the ADA chart. The Moving Average Convergence Divergence (MACD) displayed red histograms, indicating sell signals for the coin. This suggests a bearish momentum for ADA.
Additionally, the Bollinger Bands, which measure price volatility and fluctuations, showed wide bands indicating potential significant volatility for ADA in the upcoming trading sessions after it breaks out of its consolidation phase. Given these indicators, the next few trading sessions are critical for determining the direction of the Cardano price.
Featured Image From UnSplash, Charts From TradingVew.com
- SEO Powered Content & PR Distribution. Get Amplified Today.
- EVM Finance. Unified Interface for Decentralized Finance. Access Here.
- Quantum Media Group. IR/PR Amplified. Access Here.
- PlatoAiStream. Web3 Data Intelligence. Knowledge Amplified. Access Here.
- Source: https://www.newsbtc.com/news/cardano/cardano-poised-for-consolidation-in-this-price-zone-prior-to-attempting-reversal/

