Due to recent losses, the Cardano price is moving within a descending channel. Over the last 24 hours, the ADA price fell by 2%, and the altcoin price has failed to progress in the past week. The bears have maintained control of Cardano for the last two weeks.
At the moment, the ADA price is moving closer to its key support line. The technical outlook of the altcoin is siding with the bears as the altcoin lost buying pressure at press time. Both demand and accumulation fell on the daily chart, reflecting that the bears are attempting to take over the altcoin price.
The market capitalization of ADA fell on the chart, which suggests that sellers have made a subsequent entrance into the market. If ADA falls below its crucial support line, the bears will gain complete control over the price before the altcoin attempts to reverse that. For ADA to break out of the descending channel, demand has to note an appreciation over the subsequent trading sessions.
Cardano Price Analysis: One-Day Chart
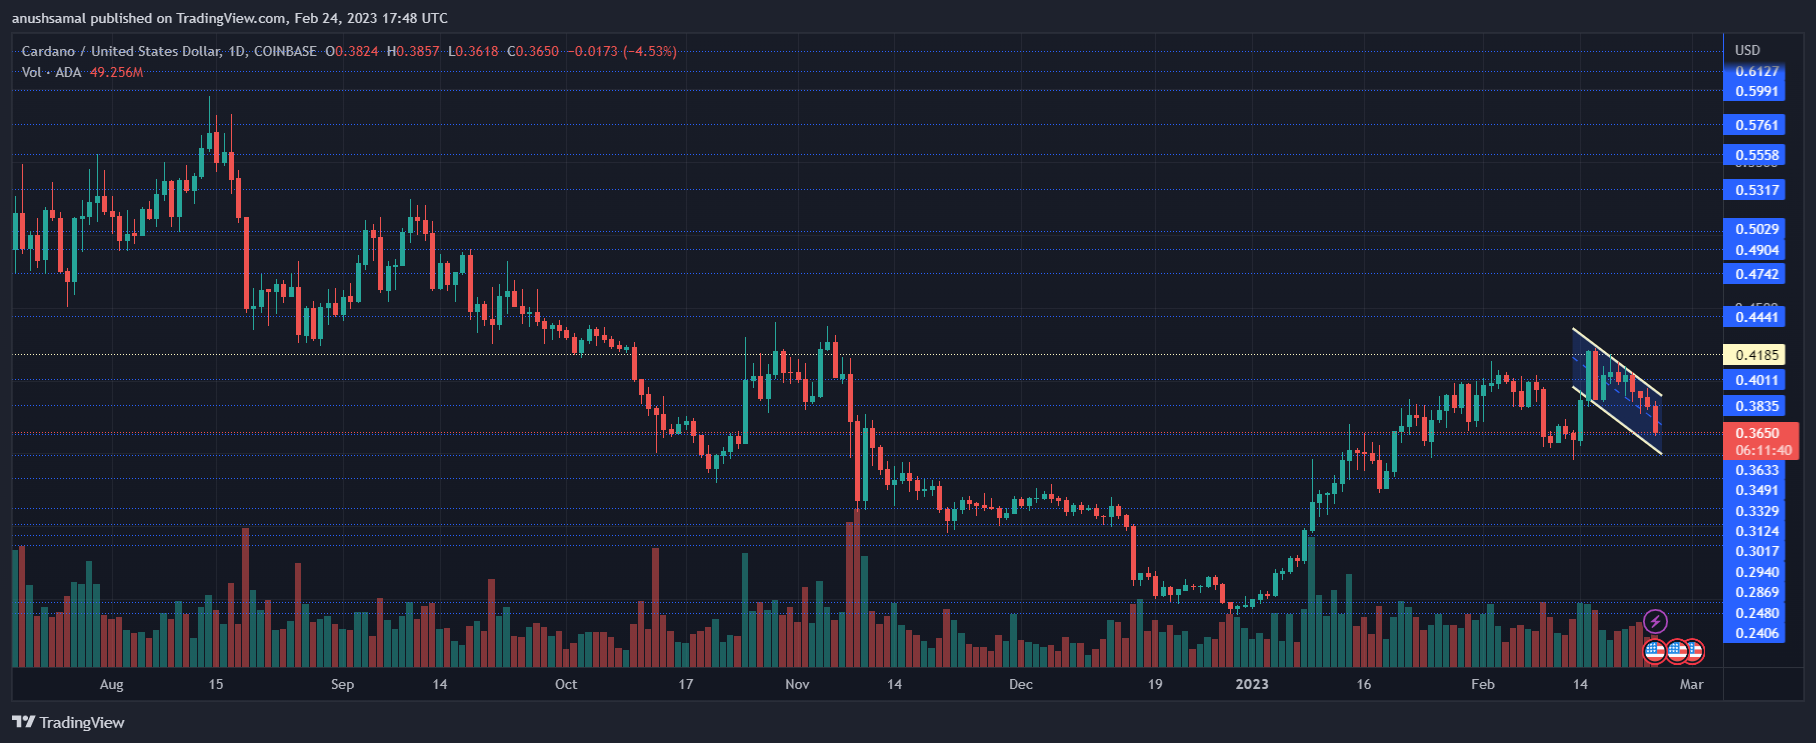
ADA was trading at $0.364 at the time of writing. It happens to be moving inside a descending channel, which reflects bearishness on the chart. The bulls struggle to defend the altcoin from falling below the direct line.
ADA has to remain above its critical, crucial level of $0.349; The altcoin just fell below a vital price floor of $0.370. Overhead resistance for the coin stood at $0.383.
Once the altcoin clears the price mentioned above the mark, it could attempt to trade near the $0.400 resistance level. The amount of Cardano traded in the last session declined, which indicated that buying strength faded.
Technical Analysis
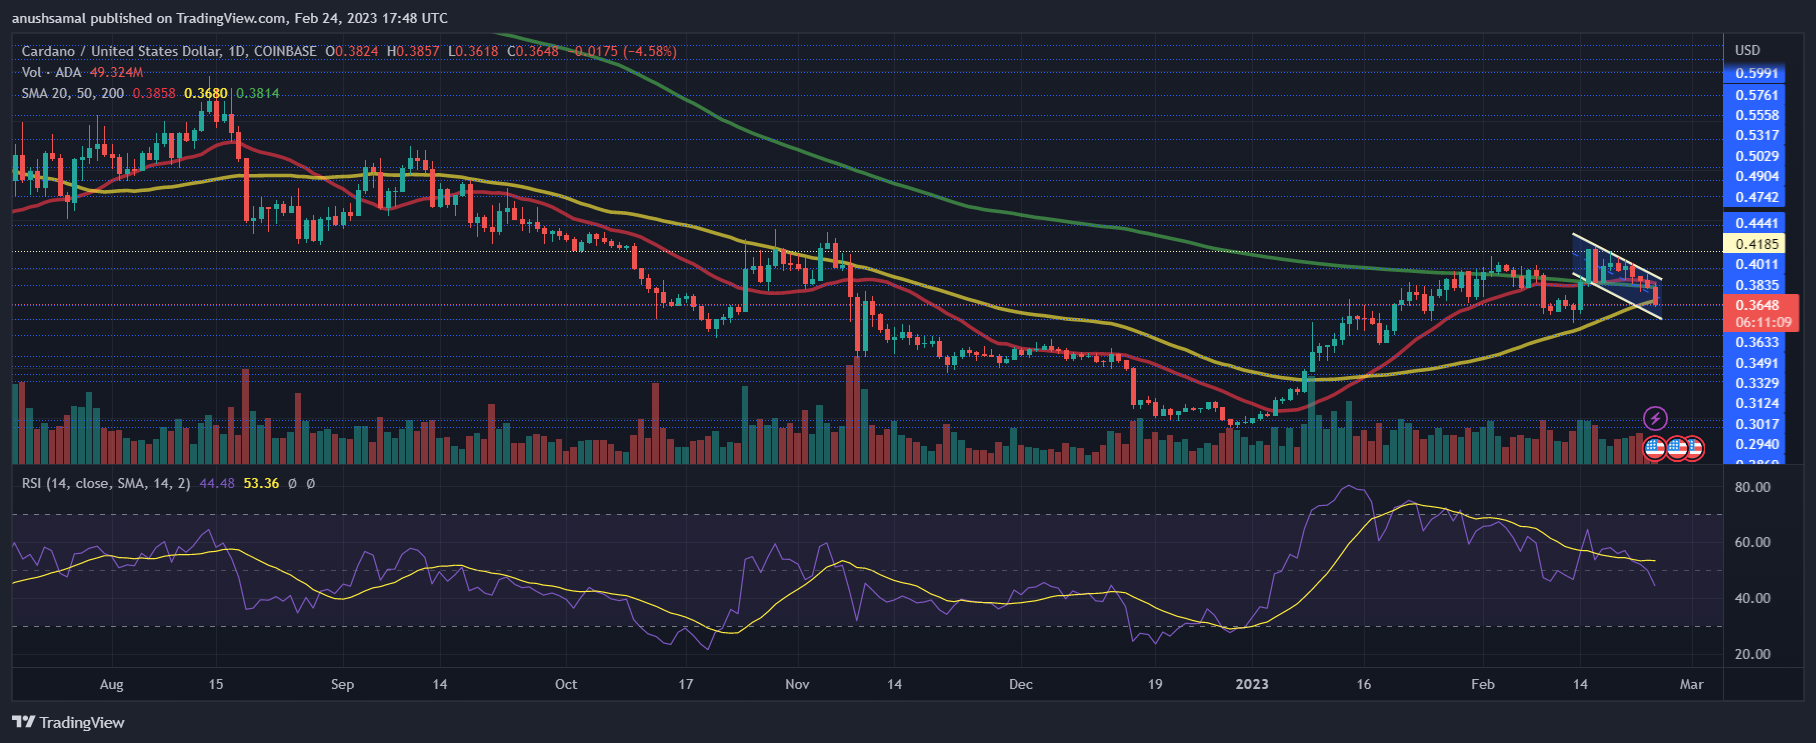
As ADA moved within the descending channel, demand for the altcoin also noted a significant fall. The Relative Strength Index fell below the half-line, meaning sellers started taking over the market.
ADA must climb above the $0.380 mark for the bears to be invalidated. Similarly, the ADA price slowly moved below the 20-Simple Moving Average (SMA) line. This meant that sellers had started to drive the price momentum in the market.
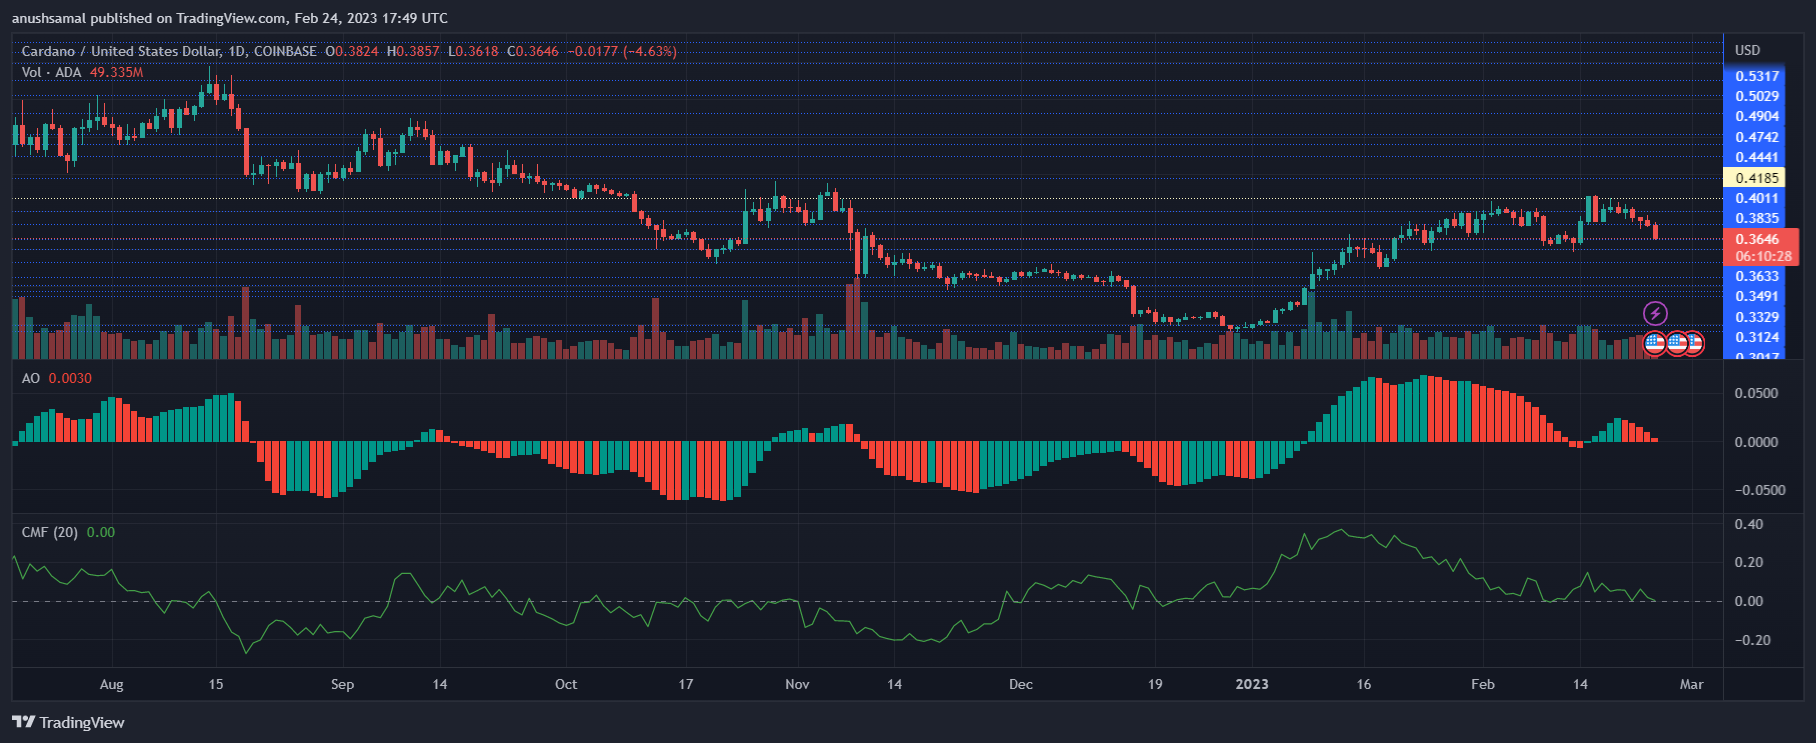
Technicals have indicated that the bears have started to take charge. The altcoin noted sell signals on the daily chart. The Awesome Oscillator shows price momentum and reversals, forming red signal bars considered sell signals for the altcoin.
The Chaikin Money Flow measures capital inflows and outflows at a given time. The indicator fell and stood on the half-line, meaning that capital inflows noted a decline, further strengthening the bearish outlook. This often means another fall in price before the coin begins to recover.
Featured Image From UnSplash, Charts From TradingView.com
- SEO Powered Content & PR Distribution. Get Amplified Today.
- Platoblockchain. Web3 Metaverse Intelligence. Knowledge Amplified. Access Here.
- Source: https://www.newsbtc.com/news/cardano/bulls-have-to-defend-this-level-to-prevent-cardano-from-sliding-further/

