- Bitcoin cash price started a fresh decline below the $265 zone against the US Dollar.
- The price is now trading below the $255 zone and the 55 simple moving average (4 hours).
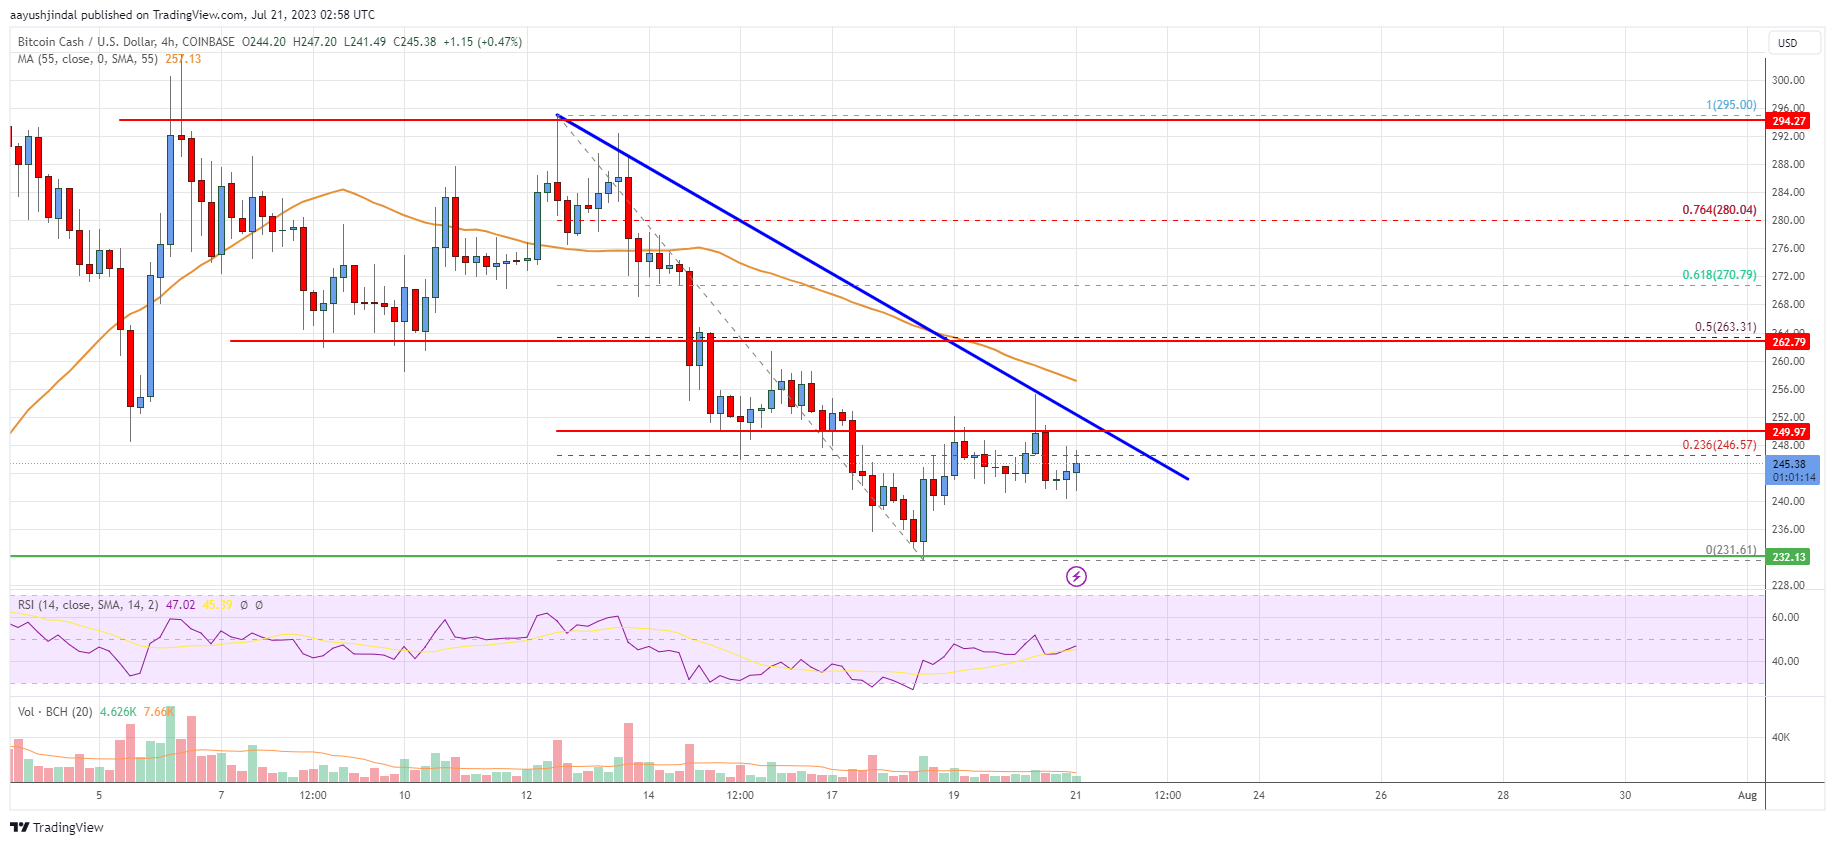
- There is a key bearish trend line forming with resistance near $250 on the 4-hour chart of the BCH/USD pair (data feed from Coinbase).
- The pair could continue to move down if it stays below the $265 resistance zone.
Bitcoin cash price is declining below the $255 zone against the US Dollar, similar to Bitcoin. BCH/USD could extend losses if there is a close below $232.
Bitcoin Cash Price Analysis
Bitcoin cash price struggled to gain pace for a move above the $295 and $300 resistance levels. BCH formed a high near $295 and started a fresh decline.
There was a clear move below the $285 and $265 support levels. The pair even declined below the $250 support. It tested the $232 zone. A low is formed near $231.61 and the price is now consolidating losses. It is now trading near the 23.6% Fib retracement level of the recent decline from the $295.00 swing high to the $231.61 low.
Besides, it is trading below the $250 zone and the 55 simple moving average (4 hours). Immediate resistance is near the $249.50 level. There is also a key bearish trend line forming with resistance near $250 on the 4-hour chart of the BCH/USD pair.
The next key resistance is near $265 and the 50% Fib retracement level of the recent decline from the $295.00 swing high to the $231.61 low. Any more gains above $115 could set the pace for a move toward the $280 level.
If there is a move above the $280 resistance, the price could rise toward the $295 zone. If not, the price might continue lower below $240. Immediate support on the downside is near the $235 zone. The next major support is near the $232 level, below which the bears might aim for $220.
Looking at the chart, Bitcoin cash price is now trading below the $255 zone and the 55 simple moving average (4 hours). Overall, the price could continue to move down if it stays below the $265 resistance zone.
Technical indicators
4 hours MACD – The MACD for BCH/USD is losing pace in the bearish zone.
4 hours RSI (Relative Strength Index) – The RSI for BCH/USD is below the 50 level.
Key Support Levels – $240 and $232.
Key Resistance Levels – $255 and $265.
- SEO Powered Content & PR Distribution. Get Amplified Today.
- PlatoData.Network Vertical Generative Ai. Empower Yourself. Access Here.
- PlatoAiStream. Web3 Intelligence. Knowledge Amplified. Access Here.
- PlatoESG. Automotive / EVs, Carbon, CleanTech, Energy, Environment, Solar, Waste Management. Access Here.
- BlockOffsets. Modernizing Environmental Offset Ownership. Access Here.
- Source: https://www.livebitcoinnews.com/bitcoin-cash-analysis-bears-in-action-below-250/

