What makes a song popular? Analyzing Top Songs on Spotify
With so many great (and not-so-great) songs out there, it can be hard to find those that match your musical preferences. Follow along this ML model building project to explore the extensive song data available on Spotify and design a recommendation engine that could help you discover your next favorite artist!
By Sunku Sowmya Sree, Senior Software Engineer | Python Developer.

Spotify is one of the newest innovations to have come to audio listening and experience with over 125 million subscribers. Though the service has recently begun, it dominates Apple Music and Amazon music in the audio streaming market. From music, they have extended the audio service to Podcasts, Audiobooks, and so on. Spotify Trends helps any content creator/musician in order to understand what listeners prefer and how to compete in this immensely growing market.
Project Overview
The two purposes of this project are:
- Build an ML model — To predict the popularity of any song by analyzing various metrics in the dataset. This prediction helps any content creator/musician to understand what Spotify listeners prefer to hear more nowadays, which is key in order to compete in the market.
To attain this objective, it’s important to start by doing exploratory analysis and achieve a few insights from data. Find out which features are highly correlated with the popularity attribute. The next step is to test different model algorithms and pick the best model based on key evaluation metric (R2 Score).
- Build a content-based recommendation system that can suggest artists for any users. This helps users listen to songs based on their music preferences.
Data
The dataset is taken from the Kaggle website. The data used in this was collected from Spotify’s Web API. This is basically a computer algorithm that Spotify has that can estimate various aspects of the audio file. More info on various attributes used in the dataset is found on this Spotify Developer page.
Some of the key attributes present in each event in the data are:
- Key — The estimated overall key of the track. Integers map to pitches using standard pitch class notation. Ex: 0 = C, 1 = C♯/D♭, 2 = D, and so on. If no key was detected, the value is -1.
- Mode — Mode indicates the modality (major or minor) of a track, the type of scale from which its melodic content is derived. Major is represented by 1 and minor is 0.
- Acousticness — A confidence measure from 0.0 to 1.0 of whether the track is acoustic. 1.0 represents high confidence the track is acoustic.
- Danceability — Danceability describes how suitable a track is for dancing based on a combination of musical elements, including tempo, rhythm stability, beat strength, and overall regularity. A value of 0.0 is least danceable and 1.0 is the most danceable.
- Energy — Energy is a measure from 0.0 to 1.0 and represents a perceptual measure of intensity and activity. Typically, energetic tracks feel fast, loud, and noisy.
- Instrumentalness — Predicts whether a track contains no vocals. The closer the instrumentalness value is to 1.0, the greater likelihood the track contains no vocal content.
- Loudness — The overall loudness of a track in decibels (dB). Values typical range between -60 and 0 dB.
- Valence — A measure from 0.0 to 1.0 describing the musical positiveness conveyed by a track. Tracks with high valence sound more positive.
- Tempo — The overall estimated tempo of a track in beats per minute (BPM).
- Popularity — The popularity of the track. The value will be between 0 and 100, with 100 being the most popular.
Exploratory Data Analysis
A. Data preprocessing
First off, we will look at how raw data looks like and then ensure data is in the usable format.

Spotify dataset.
There are no duplicates in the dataset, but it’s due to the Unique ID feature. After dropping this ID feature from the dataset, we can see 565 duplicates present in the dataset, which can be safely dropped
B. Exploring the dataset

Matplot visulaization.
The above visualization shows the variability of each metric in the dataset.

Correlation map.
A couple of insights we can derive from the above correlation table:
1) As expected, popularity is highly correlated with the year released. This makes sense as the Spotify algorithm which makes this decision generates its “popularity” metric by not just how many streams a song receives but also how recent those streams are.
2) Energy also seems to influence a song’s popularity. Many popular songs are energetic, though not necessarily dance songs. Because the correlation here is not too high, low energy songs do have some potential to be more popular.
3) Acousticness seems to be uncorrelated with popularity. Most popular songs today have either electronic or electric instruments in them. It is very rare that a piece of music played by a chamber orchestra or purely acoustic band becomes immensely popular
4) Loudness and energy are highly correlated. This makes some sense, as energy is definitely influenced by the volume at which the music is being played.
5) Acousticness is highly negatively correlated with energy, loudness, and year.
6) Valence and danceability are highly correlated. Dance songs are usually happier and in a major key
Thus, from this data, it would be better for an artist to create a high-energy song with either electric instruments or electronic songs to have the best chance of generating the most popularity.
To see how each feature is affecting the popularity, please refer to my GitHub repository (link at the end).
C. Most popular tracks

Top 15 popular tracks.
Dakiti has the highest popularity rating by this graph but was released on October 30, 2020.
D. Most popular artists

Most popular artists.
The most popular artist from 1921–2020 is the Beatles!

The Beatles popularity trend over the years.
E. Audio characteristics over the years
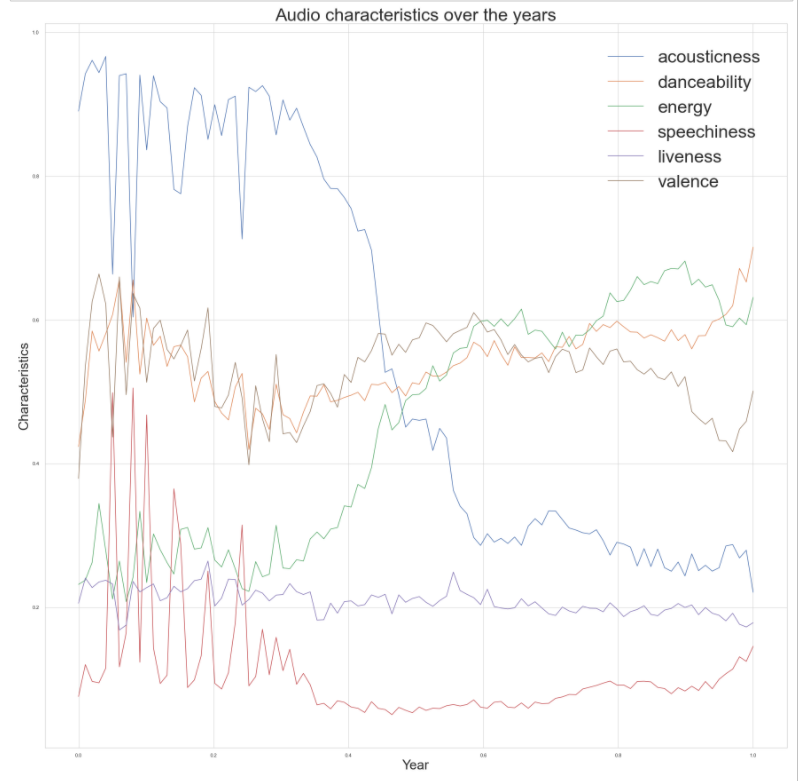
Audio characteristics over the years.
- Acousticness has decreased significantly. Most tracks past 1960 used electric instruments and, especially past the 1980s, electronic sounds. Most recorded music today includes both electric and electronic elements.
- Danceability has varied significantly but has stayed mostly at the same level since 1980.
- Energy seems to be inversely related to Acousticness: It was very low in the first part of the century, but then rose significantly after 1960. It looks like it increased even more after 2000 as well.
F. Number of songs released by year

- 2103 songs are released in the year 2018
- From the dataset creator’s own comments, it’s likely these are the 2000 most popular songs from each selected year.
ML Modelling
We need to design an ML Model that can predict the popularity based on the features available.
Feature selection: Choosing which features can be used in the model.
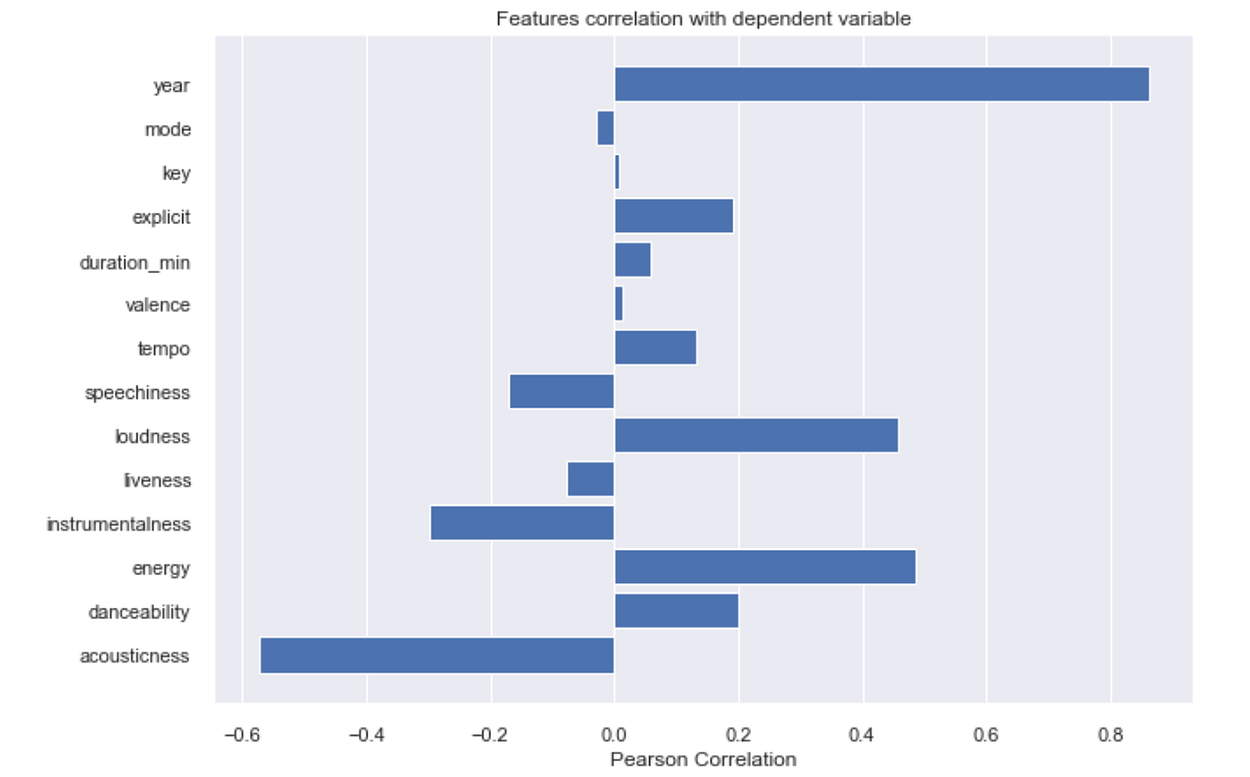
Feature selection.
In order to select the most appropriate features for the model, I am making use of the yellow brick Feature Correlation Visualizer.
The graph shows five features are with negative correlation and nine features with positive correlation.
1) id: id is unique for each track, therefore it cannot assist a model and will be dropped.
2) name: There are 132,940 unique values. This is a bit of a problematic categorical feature to insert in a model and will be dropped.
3) release_date: Release date contains full date along with the year. So instead of keeping both the columns Release_date can be dropped, and year can be inserted into the model
Feature transformations
Steps followed in the feature transformation are:
- Object data of the artists with some numerical indicator that identifies the artist.
- Eliminate zero values from tempo columns and replace it.
- Standardizing instrumental criteria with numeric values.
- Using OneHotEncoder from SKlearn to create dummies.
- Minmax scaling for relevant features.
- Target scaling for popularity column.
Model building
First, the data was split into a training (80%) and a test set (20%). With the help of Sklearn classes, this split can be made and fitted to the following model types:
- Decision TreeRegressor
- Decision Tree Regressor with Grid search CV
- Random Forest
The aim of these models is to fit and train the data and to test the accuracy of fit.

For the Decision Tree Regressor, I tried to plot RMSE for the test and train datasets and found out the most suitable value for the max_leaf_nodes parameter, which goes into the model. From the below plot, 176 seems to the best fit.
This is how the model was trained.

Python code implementation for the Decision Tree Regressor model.
Using GridSearchCV to find the optimal hyperparameters for the decision tree to predict song popularity and improve accuracy, the code below is the snippet I used to find out the best parameters to tune the model.

Decision Tree Regressor with GridSearchCV.
The most challenging part was to explore these grid search parameters as the models took a bit longer than expected to run.
Model evaluation
Generally, there are two main factors of interest when analyzing the fitting of models, Mean Absolute Error (MAE) and R2-score. The MAE measures the errors between paired observations. The lower the differences, the better the model performance.
The reason I chose the R2-score here is that we are working on the regressor model rather than the classifier model.
The R2-score function computes R². It provides a measure of how well future samples are likely to be predicted by the model. The best possible score is 1.0 and it can be negative (because the model can be arbitrarily worse). A constant model that always predicts the expected value of y, disregarding the input features, would get an R² score of 0.0.

From the above analysis, the Decision Tree Regression Model along with Grid Search CV proved to have the most reliable results. In comparison with Random Forest and Decision Tree Regressor models, the Random Forest model resulted in less accuracy.
Song recommendation system
Building a recommendation system where it recommends similar songs for any given song.
Here I used Neighbourhood Collaborative Filtering using the similarity metrics method. By calculating the Manhattan Distance using all numerical features available in the dataset, I found the neighbour songs which have relatively less distance.

Recommendations for “Canon in D.”

Recommendations for the song “Dynamite.”

Recommendations for the song “Lovely.”
Conclusion
Let’s take a step back and look at the whole journey.
- The objective was to predict the popularity of any song and build a recommendation system to recommend songs.
- Performed exploratory data analysis to derive insights from the data.
- Mostly 2000 popular songs are identified and added every year in Spotify.
- The most popular artist from 1921 to 2020 is the Beatles.
- The most popular song is Dakiti by Bad Bunny & Jhay Cortez’s released on October 30, 2020.
- The data was split into train (80%) and test (20%) datasets for model building and evaluation, respectively.
- Using GridSearchCV, we could find the optimal hyperparameters for the decision tree regressor model and achieved an accuracy of 76.6%.
Future Enhancements
- Build a recommendation engine that can either recommend similar artists or recommend songs for any given user. There are no user-related data available here, but we can insert data randomly to test out
- Use alternative ML models that can improve the accuracy of the predictions
GitHub Repo
You can follow along with the Jupyter notebooks from my GitHub repository. With the solution in mind, this will be the sequence of our workflow.
Original. Reposted with permission.
Bio: Sunku Sowmya Sree is a senior software engineer with 3+ years of experience, and started working as a Python developer who was later driven into Automation Testing and Development.
Related:
Top Stories Past 30 Days
|
|
Coinsmart. Beste Bitcoin-Börse in Europa
Source: https://www.kdnuggets.com/2021/04/song-popular-analyzing-top-songs-spotify.html

